Back Office › Analytics › Performance › Suggestion Results shows what the suggestions led to: how many were shown, how many staff acted on, the sales they added, and — most important — what orders with suggestions spent compared with orders that got none.
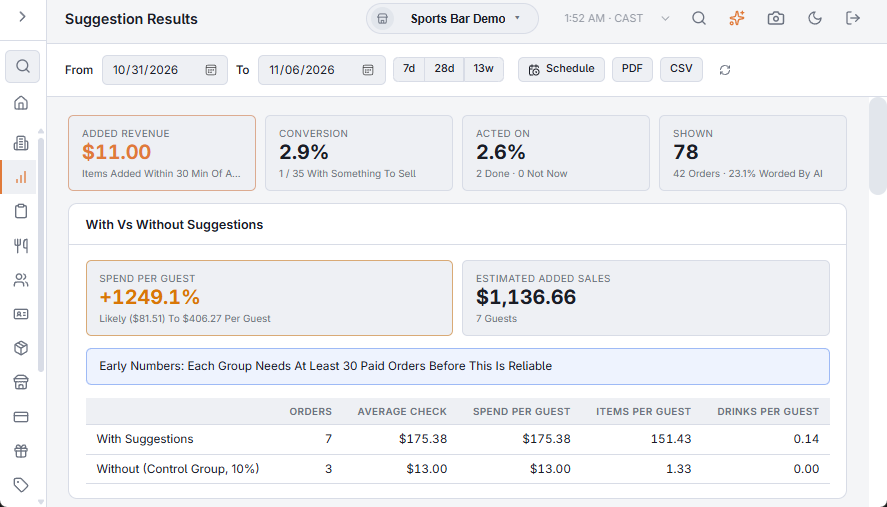
The tiles
- Added Revenue: the sales of the suggested item, category or drink added to the same order (and guest) within 30 minutes of the suggestion.
- Conversion: of the suggestions with something to sell, how many sold.
- Acted On: sold, or marked Done by the server; with the Done and Not Now counts.
- Shown: suggestions shown, on how many orders, and how many were worded by AI.
With vs without suggestions
A small share of orders never gets suggestions, picked at random (the control group). This section sets the paid orders where staff looked at suggestions against the paid orders where they looked and got none: average check, spend per guest, items and drinks per guest. Spend Per Guest shows the difference and its likely range; Estimated Added Sales is that difference times the guests served with suggestions.
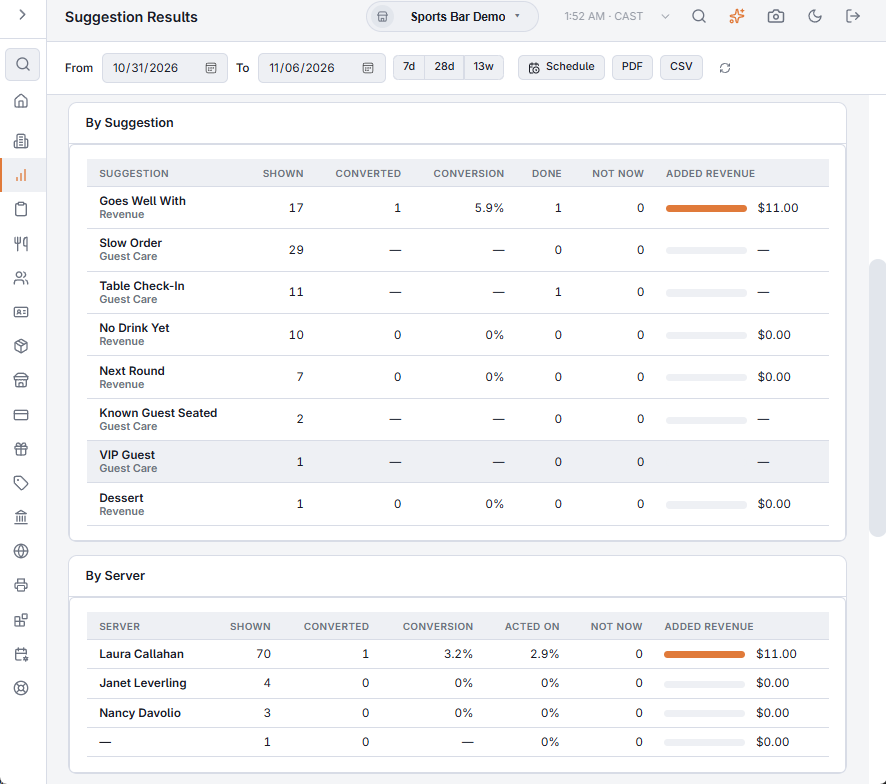
By suggestion and by server
The two tables break the results down by kind of suggestion and by the order's server. CSV exports all three sections.
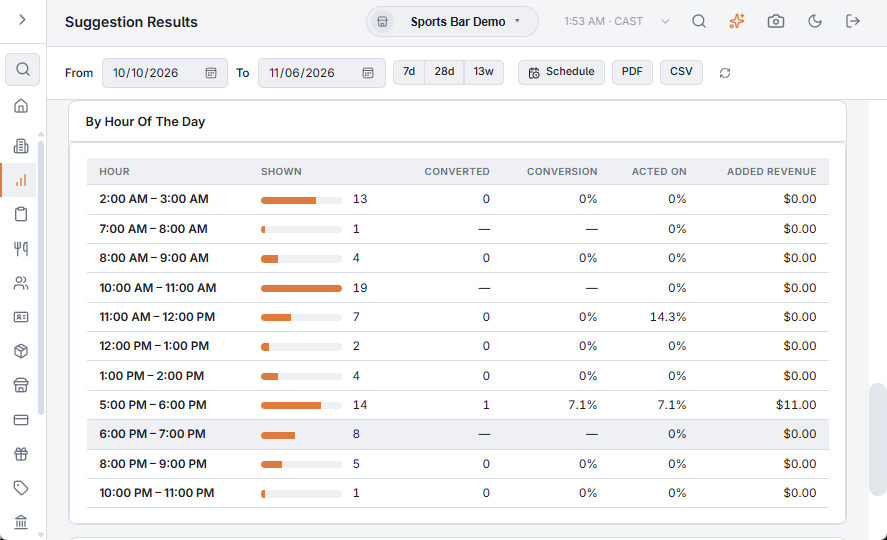
By hour of the day
When in the day the suggestions are shown and how well they convert, hour by hour in store time.
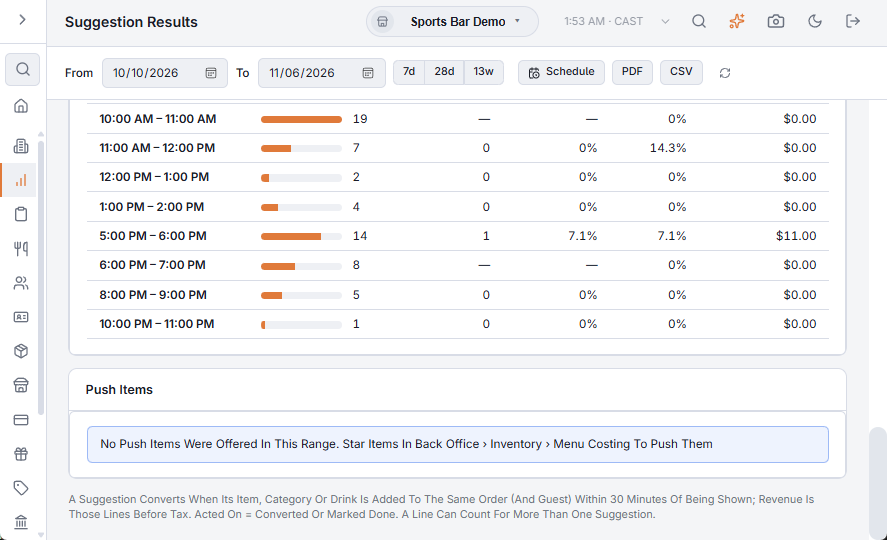
Push items
Each push item: how often it was offered (as the push, or while starred as a pairing), on how many orders, how often it sold and the sales it added. A star marks the items on tonight's list.
PDF and scheduled email
PDF builds the whole report; Schedule emails it on a regular basis, like the other reports. An upgrade counts as converted when its option is added to the item.