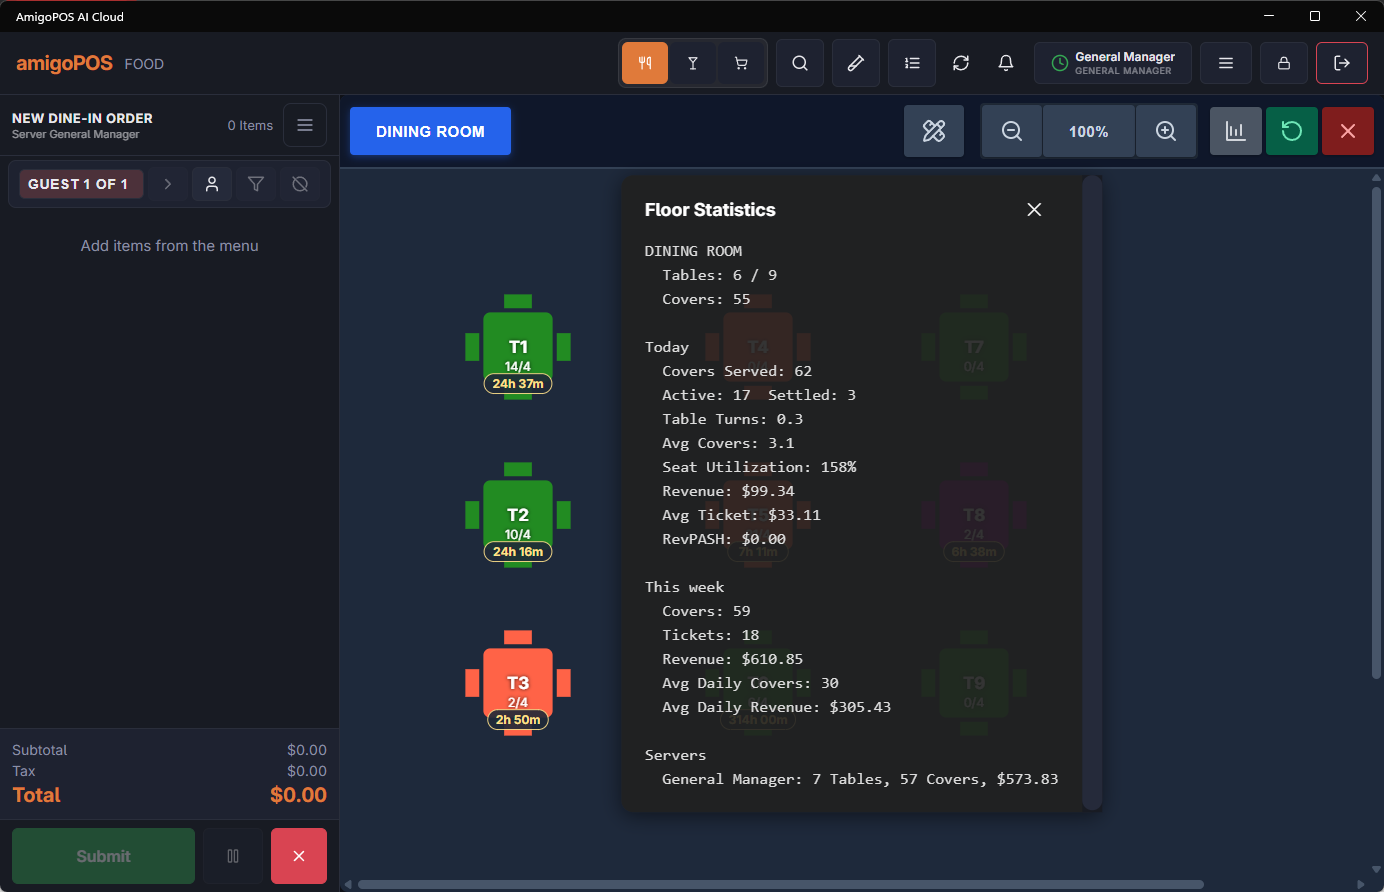
Floor stats (the stats action on the seating chart) is the dining room’s analytics layer — how the room and each table actually perform.
Room-level
For today and this week: covers served, revenue, orders, table turns, average dwell time, average ticket and per guest, seat utilization, peak hour, and the 30-day trend — with averages per day and per turn. Dwell time and turns are the capacity levers: a room turning tables in 50 minutes and a room in 80 are different businesses on the same floor plan.
Table-level
Selecting a table shows its numbers — covers, revenue, turns, average time and ticket here, and its revenue rank among tables. The spread is the insight: if table 12 earns half of table 4, the difference is location, drafts, sightlines, or which server’s section it sits in — all fixable once visible.
What to do with it
- Seat utilization low at peak hour = a hosting problem (parties of 2 on 4-tops); the fix is in seating discipline or the designer’s table mix.
- Dwell time creeping up shows here before revenue shows it — cross-check the stage breakdown in the service-pace report.