Back Office › Analytics › Ask For A Report answers a question about your own business in plain words, and gives back a real report: headline figures, a chart and the table behind them. It is the second entry under Analytics, after Overview. The page is hidden on plans that don’t include AI Reports.
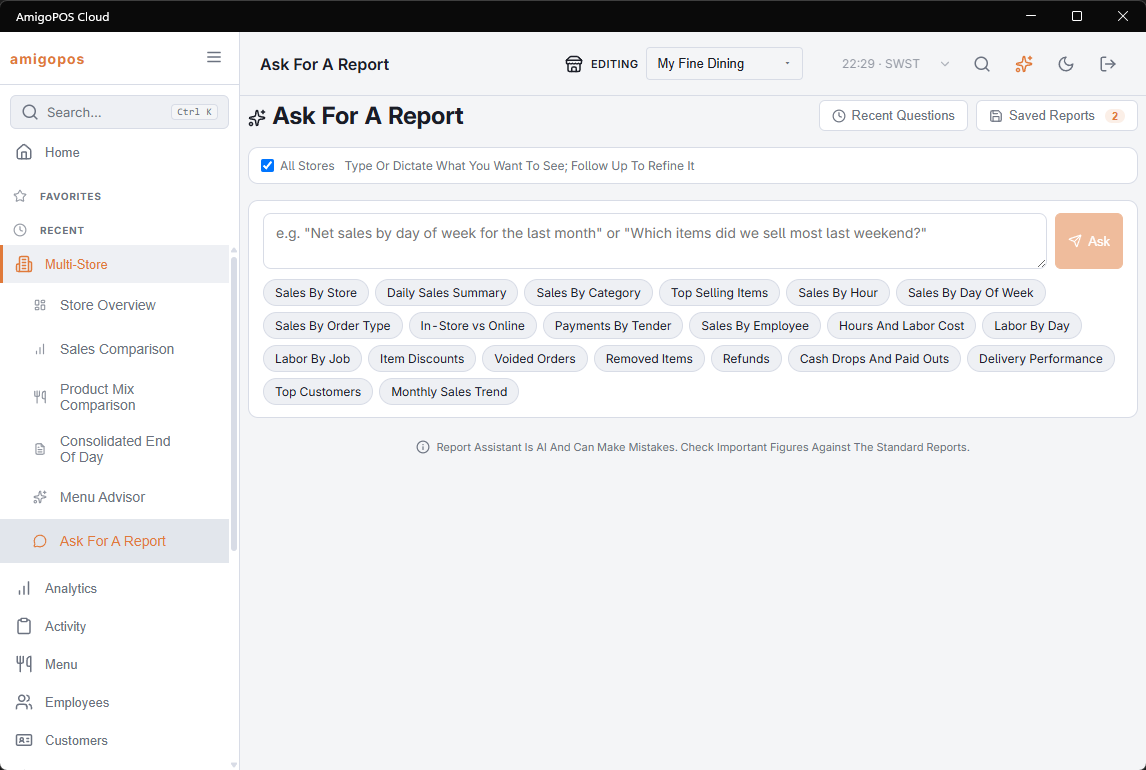
For employees with access to all stores of a business with more than one store, the same page also appears under Back Office › Multi-Store › Ask For A Report, where it starts with All Stores ticked. See Reports across all stores.
How to start
- Type a question, or use the microphone where dictation is available on your device.
- Send it. The report arrives in a few seconds.
- Ask the next question. Each answer stays on the page until you dismiss it, or select Clear.
Starters
The page opens with a set of ready-made questions: daily sales, sales by category, by item, by hour, by weekday, by order type, by employee, tenders, labour, discounts, voids, removed items, refunds, cash drops and pay-outs, deliveries, top customers and the monthly trend. They are the fastest way to see what the page can do. Hide Examples puts them away and Show Examples brings them back.
What it does not do
It only reads. It cannot change the menu, refund an order, edit a shift or alter a figure — it builds a report and runs it against what is already there.
Call center
Two datasets for businesses with a call center. Call Center Calls: calls, how many became orders, abandoned, conversion and average handle time — by agent, outcome, order type, store, day and hour. A call counts for the store its order went to; abandoned calls only show with “all stores”. Call Center Orders: orders, sales, average minutes to acknowledge, not acknowledged, held waiting for a pay link, changed after sending and voided — by agent, order type, customer, status, store, day and hour. Two starters come with them: Call Center Orders by day, and Calls By Agent.