The Inventory Valuation report puts a value on everything on the shelf: every item that is not hidden, with its live on hand and what that stock is worth, grouped by category with subtotals. You print it from Back Office › Inventory › Setup › Items List. It is the figure an accountant asks for at month end.
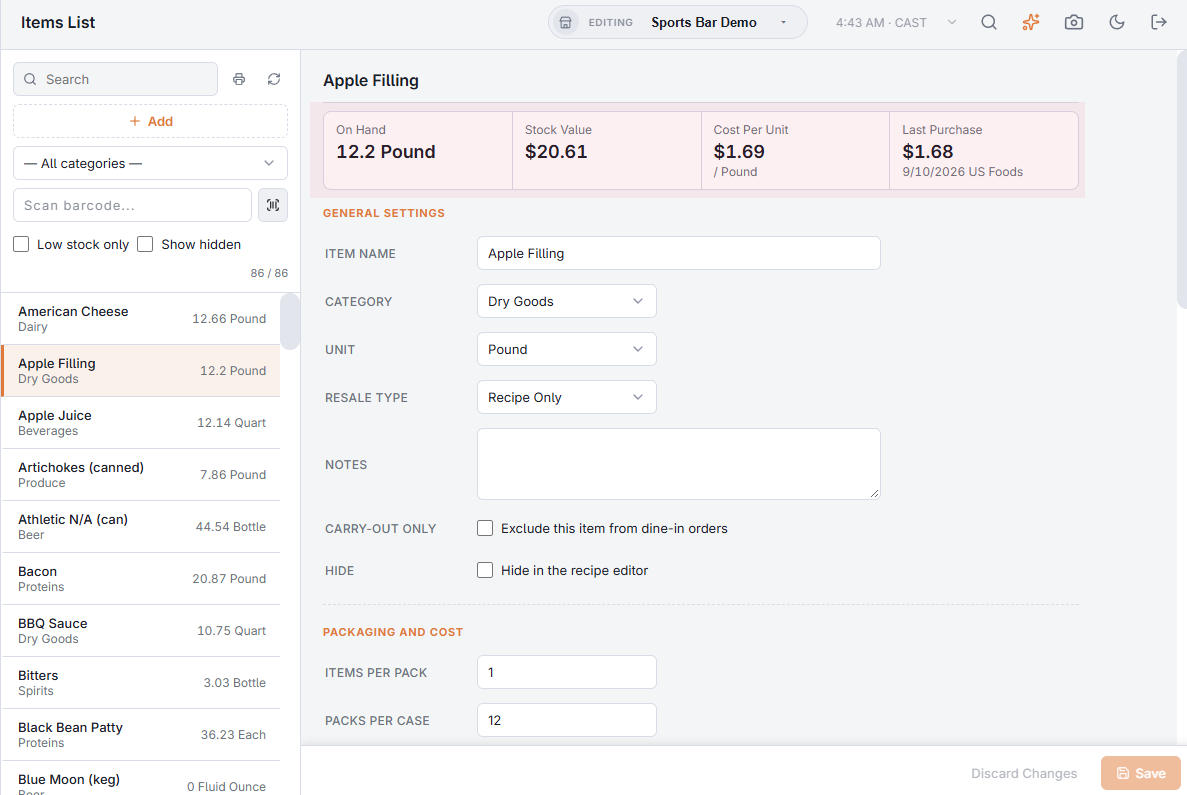
- Open Items List.
- Pick a category in the list’s category filter to value one category, or leave it on all.
- Tap the printer button next to Refresh. The PDF preview opens with Download and Email.
What the report shows
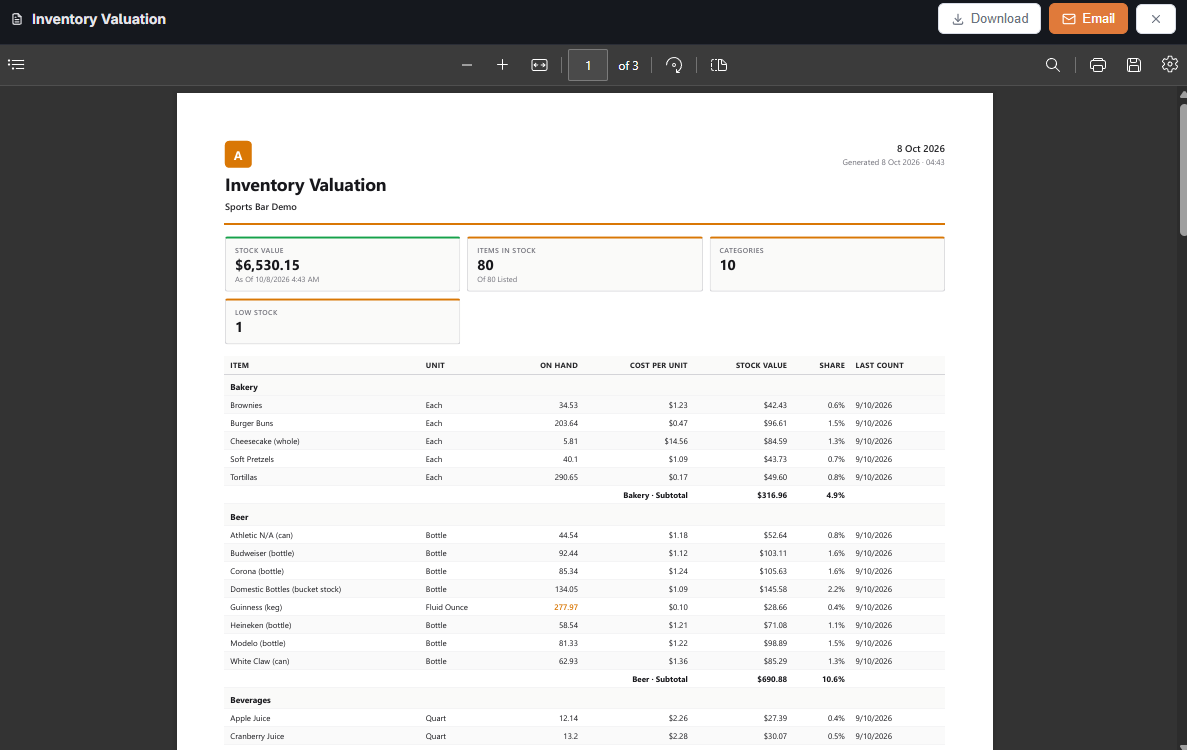
- At the top: the total Stock Value as of the time it was built, Items In Stock out of the items listed, the number of Categories, and Low Stock with how many items are sold short.
- Per item: Unit, On Hand, Cost Per Unit, Stock Value, its Share of the total and the Last Count date. Items at or below their reorder level and items sold short are marked.
- A subtotal for each category and the total at the end.
How the value is calculated
Stock arrives in lots — deliveries, transfers in, prep batches and returns — each at the cost it came in at, and sales use up the oldest lot first (see How inventory works). The value of an item is the remaining quantity of each of its lots at that lot’s cost, so a price change at the supplier only affects the stock bought since. An item sold short (negative on hand) carries no value until stock arrives. Unit cost on a line with stock is value ÷ on hand; a line with nothing on hand shows the item’s current unit cost for reference.