Back Office › Analytics › Analytics › Sales breaks down the sales for the dates on the toolbar by day, hour, order type, server, category and item, and lists the voided tickets and lines and the most-used modifiers.
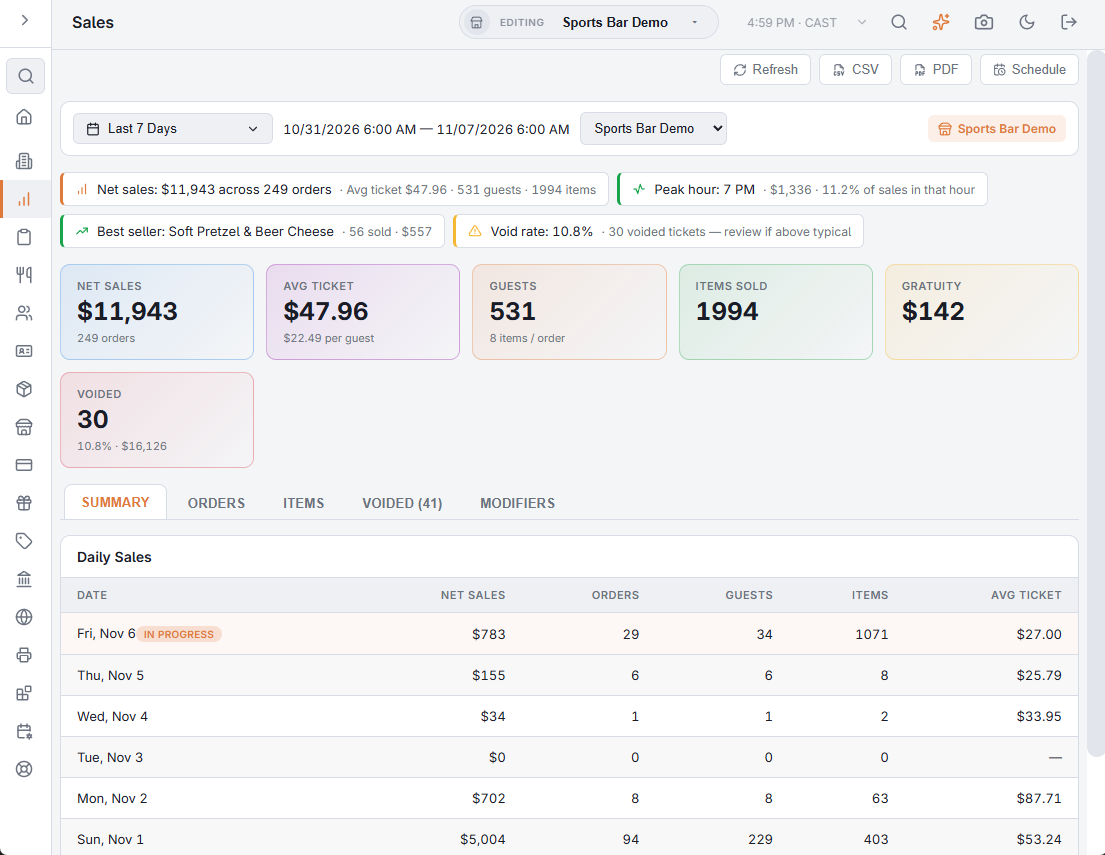
The page counts every ticket in the period that is not voided, including tickets still open. Net Sales here is the tickets’ order total, gift cards sold included, so it can be higher than Net Sales on the Overview and insights strip. For the dates, store and export buttons, see Exporting and PDF preview.
Insights
Up to four lines across the top: net sales and orders (with the average ticket, guests and items), the Peak hour, the Best seller by revenue, and the Void rate when it is above 5%.
KPI cards
| Card | What it shows |
|---|---|
| Net Sales | Order totals, with the number of orders. |
| Avg Ticket | Net sales per order, and per guest below it. |
| Guests | The guest count (a ticket without one counts as one guest), with items per order. |
| Items Sold | Items on the tickets, without modifiers and without removed lines. |
| Gratuity | Gratuity on the tickets. |
| Voided | Voided tickets, with the void rate (voided out of all tickets) and their subtotal. The card turns red above 5%. |
Summary tab
Daily Sales: one row per day, newest first, with Date, Net Sales, Orders, Guests, Items and Avg Ticket, and a total row. Today is marked In Progress.
Orders tab
- Hourly Pattern — each hour that had sales, across all the days: Hour, Net Sales, Orders and % of Total. The busiest hour is tagged Peak Hour. Hours are written the way your language writes them, for example 1 PM or 13.
- By Order Type — Order Type, Net Sales, Orders, Avg Ticket and % of Total.
- By Server — the employee who owns each ticket: Employee, Net Sales, Orders, Guests, Avg Ticket and % of Total.
Items tab
- By Category — Category, Unique Items, Qty Sold, Revenue and % of Total.
- Top Sellers — the 20 items with the highest revenue: Item (with its category), Qty and Revenue.
- Slow Movers — the 20 items with the lowest revenue among those that sold at least one.
Voided tab
The tab shows how many voided tickets and lines it lists.
- Voided Tickets — newest first, up to 200: Ticket #, Date/Time, Order Type, Created By, Voided By and Subtotal.
- Voided Items — lines removed from tickets that were not voided, newest first, up to 200: Ticket #, Date/Time, Item, Employee (who rang the line), Qty and Amount.
Modifiers tab
Top Modifiers: the 30 modifiers sold most often, with Modifier, Qty Sold, Revenue and Avg Price.
Export
CSV exports every table: daily, hourly pattern (all 24 hours), by order type, by server, by category, top sellers, slow movers, voided tickets, voided items and top modifiers. PDF opens the Sales Analytics Report with the same sections.
All Stores
With All Stores selected, the page adds up every store. Averages and shares are worked out again from the totals, and the peak hour is picked from the combined hours. Order types, categories and modifiers with the same name at different stores share one row; an employee who worked at two stores has one row on By Server. The voided lists hold each store’s rows, up to 200 per store.
Top Sellers and Slow Movers are built from each store’s own 20 top sellers and 20 slow movers, added up by item name and category, and Top Modifiers from each store’s 30. An item that is outside every store’s lists is not counted, so the combined lists can miss an item that sold moderately at every store.
The PDF covers one store. With All Stores and more than one store, pick a store before you open it.