Back Office › Analytics › Overview is the first page of Analytics. It shows today’s sales so far, the main figures for the dates on the toolbar, and tiles that open the other reports.
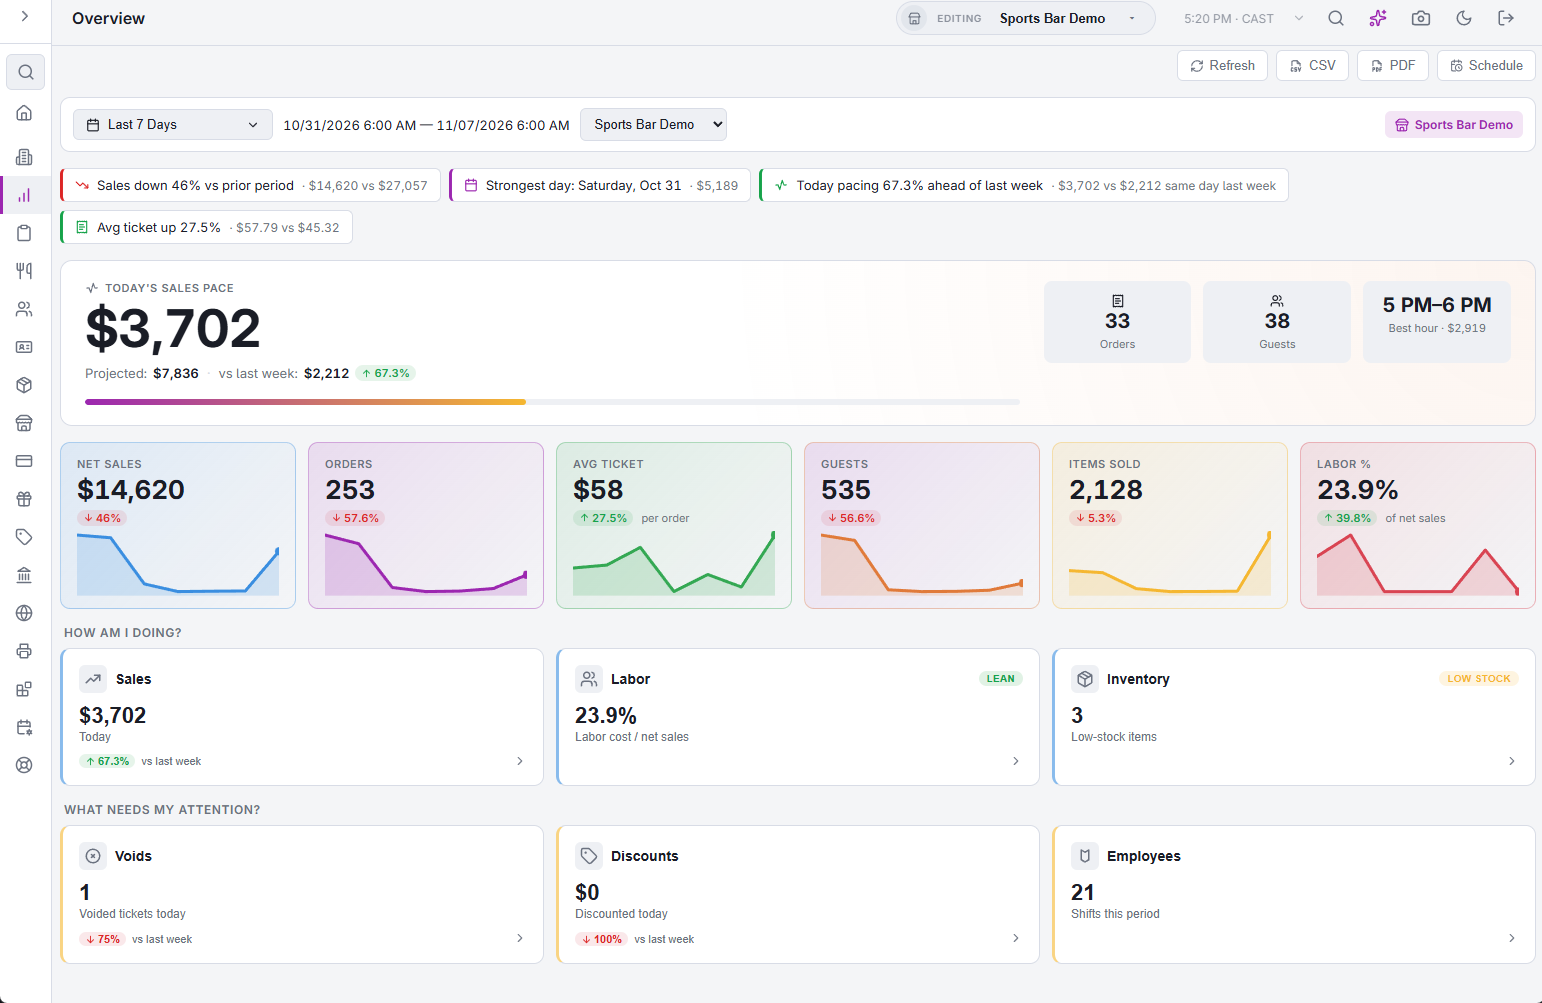
The dates and store come from the toolbar; see Exporting and PDF preview. The dates change the insights, the KPI cards and the Labor and Employees tiles. The sales pace and the other tiles always show today’s business day.
Insights strip
Up to five short lines across the top. Each one shows only when its condition is met.
| Insight | Shows when |
|---|---|
| Sales up / down vs prior period | Net sales for the dates differ by 3% or more from the same number of days just before them. |
| Strongest day | The dates include at least three days with sales; it names the day with the highest net sales. |
| Today pacing ahead of / behind last week | Today’s sales so far differ by 5% or more from the same weekday last week up to the same time of day. |
| Labor cost is …% of sales | Labor cost is above 40% of net sales for the dates (target 28–35%). |
| Labor cost is very lean | Labor cost is below 20% of net sales and there are more than 10 orders. |
| Avg ticket up / down | The average ticket differs by 5% or more from the period before. |
Today’s sales pace
- Today’s sales pace — net sales of the current business day so far.
- Projected — today’s sales so far scaled up to a full 24-hour business day at the same rate. Early in the day it is a rough figure.
- vs last week — net sales of the same weekday last week up to the same time of day, with the change against today in a badge. At 11:00 today is compared with last week’s day up to 11:00.
- The bar under the figures shows how much of the 24-hour business day has passed; point at it to see the percentage.
- Orders and Guests today, and the Best hour so far with its sales.
KPI cards
Net Sales, Orders, Avg Ticket (per order), Guests, Items Sold and Labor % (of net sales) for the dates on the toolbar. Each card shows the change against the same number of days just before, and a small line of the daily values. A change under 0.5% shows as flat.
- Net sales count tickets that are not voided, after discounts and with tax, and leave out gift cards sold.
- Items Sold counts items, not modifiers.
- On Labor % the badge is reversed: an up arrow means labor took a smaller share of sales.
Tiles
Tiles sit in two groups, How am I doing? and What needs my attention?. Tap a tile to open its page. A tile whose page is hidden in your sidebar, because of your plan or your access, is not shown; for example, there is no Inventory tile on a plan without Inventory. On the tiles, last week means the same weekday last week up to the same time of day.
| Tile | Shows | Opens |
|---|---|---|
| Sales | Today’s net sales, with the change vs last week. | Sales performance |
| Gift card sales | Gift cards sold today, which the Sales tile leaves out. Shows only when gift cards were sold today or last week. | Gift & Loyalty › Cards (see The Cards overview: balances, activity and breakage). If that page is hidden for you, the tile does nothing. |
| Labor | Labor cost as a share of net sales for the dates: Lean under 28%, Healthy 28–35%, Elevated 35–40%, High above 40%. | Labor performance |
| Inventory | Items at or below their reorder level now. The tag reads Stock OK when there are none and Low Stock otherwise. | Inventory performance |
| Voids | Voided tickets today, with the change vs last week. The tag reads No Voids when there are none, and Above Usual when today has more than one and a half times last week’s count. | Sales analytics |
| Discounts | The amount discounted today, with the change vs last week. | Discounts analytics |
| Employees | Shifts started during the dates on the toolbar. | Employee analytics |
All Stores
With All Stores selected, the page adds up every store: the sales pace, the KPI cards, the tiles and the insights. Avg Ticket is worked out as the stores’ net sales divided by their orders, and Labor % as their labor cost divided by their net sales. The tiles and insights follow the same rules as for one store, applied to the totals. The KPI cards show no change badge.
Export
CSV exports three sections: Key Metrics (each KPI card’s label, value and change %), Section Tiles (the tiles shown, with value, detail, status and change %) and Insights (the text of each line). PDF opens the Overview Report: Today’s Pace, Period KPIs, a Section Snapshot of the tiles, and the Insights. With All Stores and more than one store, pick a store first; see Exporting and PDF preview.