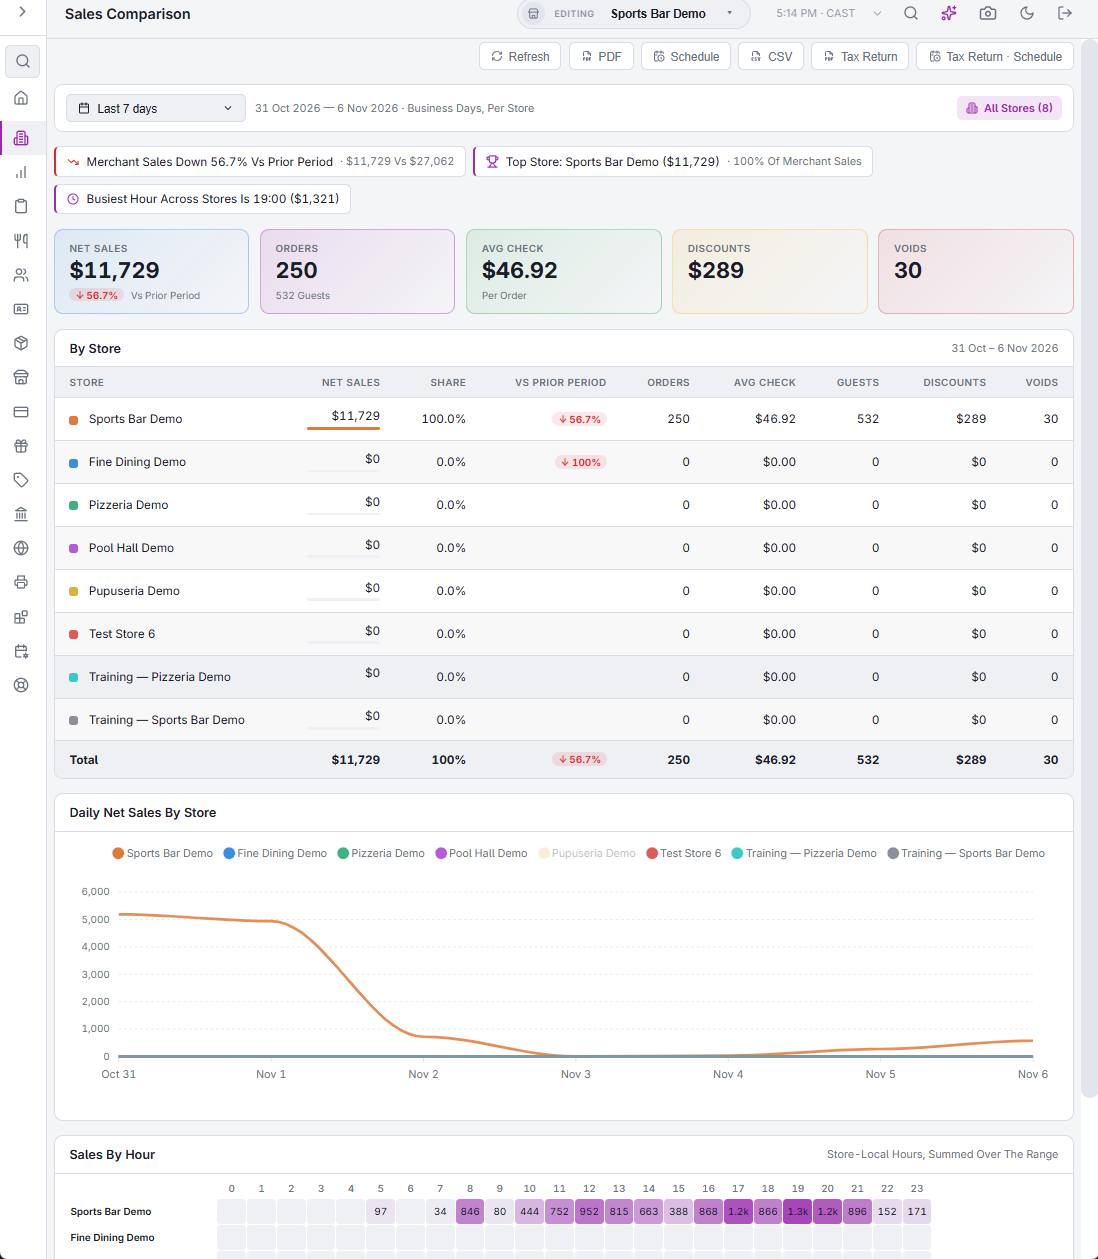
Back Office › Multi-Store › Sales Comparison puts every store on the same dates, so the differences between them are the only thing left to look at. Each store is measured on its own business days.
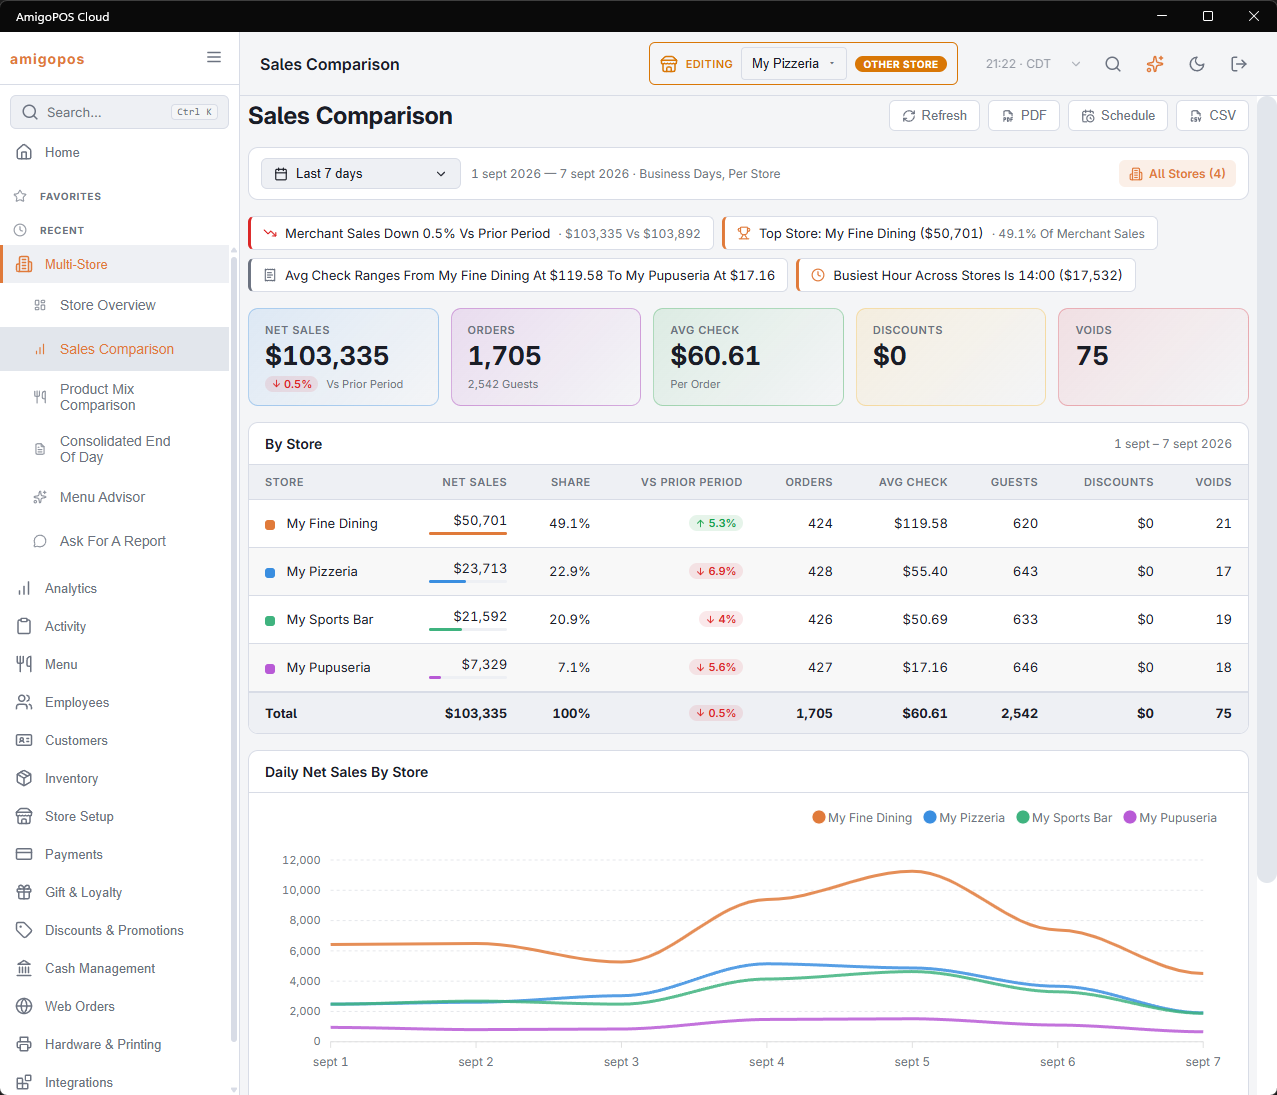
Choosing the dates
The date button opens on Last 7 days. Pick Today, Yesterday, Last 7 days, Last 30 days or Month To Date, or type dates in Start and End; the button then reads Custom Range. The page reloads as soon as you choose. The note beside the button gives the dates and Business Days, Per Store: a late-closing store’s night counts on the day it started. A range longer than a year is cut to the last 366 days.
Header buttons
- Refresh — loads the figures again.
- PDF — the comparison as a document, for all stores.
- Schedule — emails that PDF on a schedule.
- CSV — the store table, the daily figures and the hourly figures in one file. The store table’s columns are Store, Net Sales, Share %, Vs Prior Period %, Orders, Avg Check, Guests, Discounts and Voids, with the headings in the language Back Office is shown in.
- Tax Return and Tax Return · Schedule — the sales tax return for every store over the same dates; see below.
The PDF preview, emailing it and scheduling work as on the Analytics pages; see Exporting and PDF preview.
What is on the page
- Insights — the account’s sales up or down against the period before; the top store and its share; the spread between the highest and lowest average check, when it is 25% or more; and the busiest hour across the stores.
- Totals — Net Sales with Vs Prior Period (the same number of days just before the range), Orders with guests, Avg Check, Discounts and Voids (voided orders).
- By Store — one row per store, highest net sales first: Net Sales with a bar, Share, Vs Prior Period, Orders, Avg Check, Guests, Discounts and Voids, and a total row. A store that could not be read is marked with !.
- Daily Net Sales By Store — one line per store across the range, for finding the day something changed.
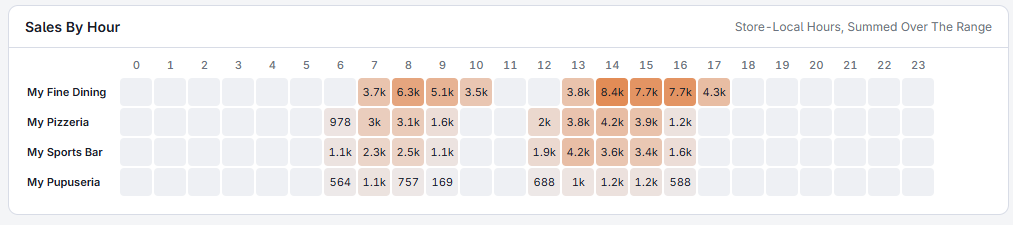
- Sales By Hour — a grid of stores against the hours 0–23, in each store’s local time and added up over the range. Darker cells sold more; point at a cell for its sales and order count.
Sales tax return for all stores
Tax Return builds one PDF for the page’s dates: the total for all stores first, then a section per store on its own clock. Tax Return · Schedule emails it on a schedule; monthly on the first suits most filings. See Filing your sales tax return.