Back Office › Analytics › Performance › Check Builder shows how often each menu category lands on a check, which servers sell it best, and how much more you would sell if the rest of the team matched them. The average check grows one add-on at a time: a starter, a second drink, a dessert. The page is read-only.
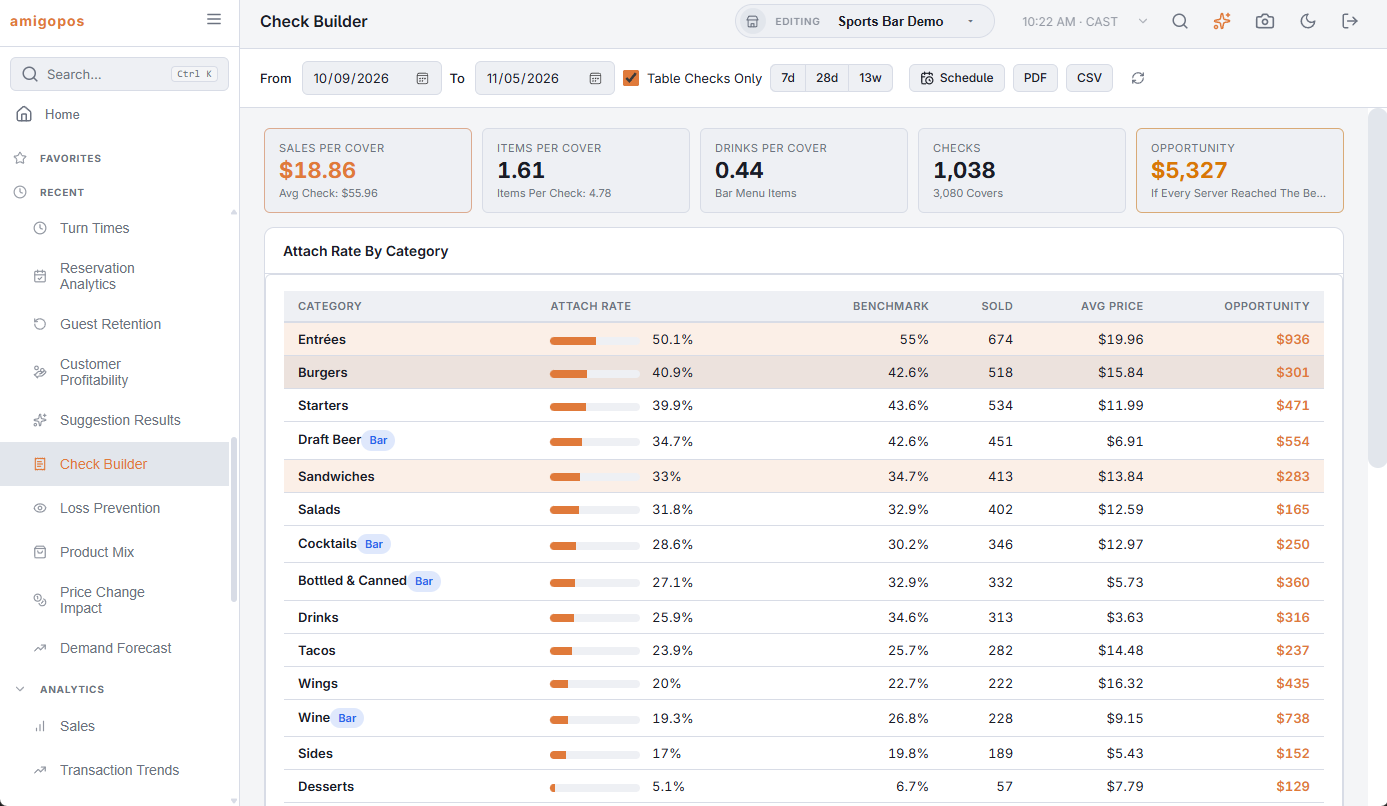
The toolbar
- From and To — the business days to count. The page opens on the 28 days up to yesterday.
- Table Checks Only — leaves out takeout, delivery and bar tabs without a table; usually what you want when coaching servers.
- 7d, 28d and 13w — the last 7 days, 28 days or 13 weeks, ending yesterday.
- Schedule — emails the report as a PDF on a recurrence; Table Checks Only and the categories you picked for the server table are saved with it. See Emailing the performance reports on a schedule.
- PDF (preview, download, email) and CSV — the same report as a file; the PDF shows the same server columns as the page. See Exporting and PDF preview. The file’s section titles, column headings, day names and Yes/No values are in the language the Back Office is shown in; numbers use a dot for decimals with no thousands separator, and dates are written year-month-day, so a spreadsheet reads them the same in any language.
- The refresh button loads the figures again.
The numbers at the top
- Sales Per Cover — net sales per guest, with the average check.
- Items Per Cover — menu items per guest, with items per check.
- Drinks Per Cover — bar menu items per guest.
- Checks — settled checks in the range, with their covers.
- Opportunity — extra sales if every server reached the benchmark in every category.
Attach rate by category
The attach rate is the share of checks with at least one item from the category: 30% for Desserts means three checks in ten had a dessert. Categories are listed by attach rate, up to 30, with a Bar badge on bar categories, the units sold and the average price. The Benchmark is the rate of the server at the 75th percentile among servers with 20 or more checks — a level a quarter of your team already beats, so it is reachable. It needs at least two such servers; otherwise the column shows a dash. Opportunity adds up, for every server below the benchmark, the checks they would need to reach it × the category’s average price.
The three categories with the biggest opportunity are highlighted and shown as columns in the server and daypart tables. Click a category row to add it to or remove it from those tables (up to five).
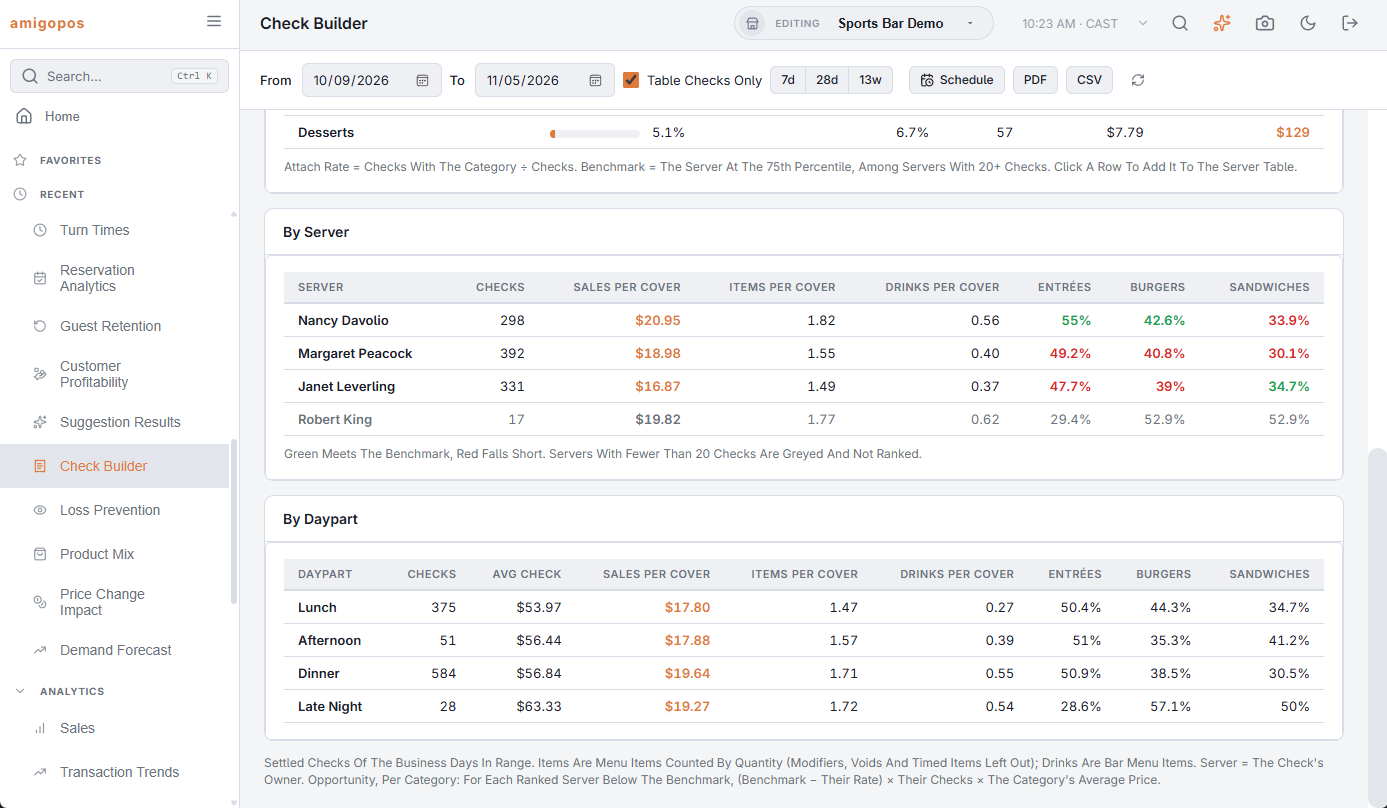
By server
Each server’s checks, sales, items and drinks per cover, and their attach rate in the highlighted categories: green meets the benchmark, red falls short. Servers with fewer than 20 checks are greyed and not ranked — too few checks to judge.
By daypart
The same per-cover numbers, the average check and the highlighted categories’ attach rates for breakfast, lunch, afternoon, dinner and late night, so you can see, for example, that dessert sells at dinner but not at lunch.
What to do with it
- Pick one category with a big opportunity and coach the red servers on it for two weeks; pair them with a green one.
- Set up a Suggestive selling overview program for that category and pay a small reward per sale.
- Check again after the range and compare.
The AI assistant can answer the same questions: “Who sells the most desserts?”