Back Office › Analytics › Performance › Guest Retention shows how many of your guests come back, how often, and which regulars have quietly stopped coming. Winning back a regular costs less than finding a new guest. The page is read-only.
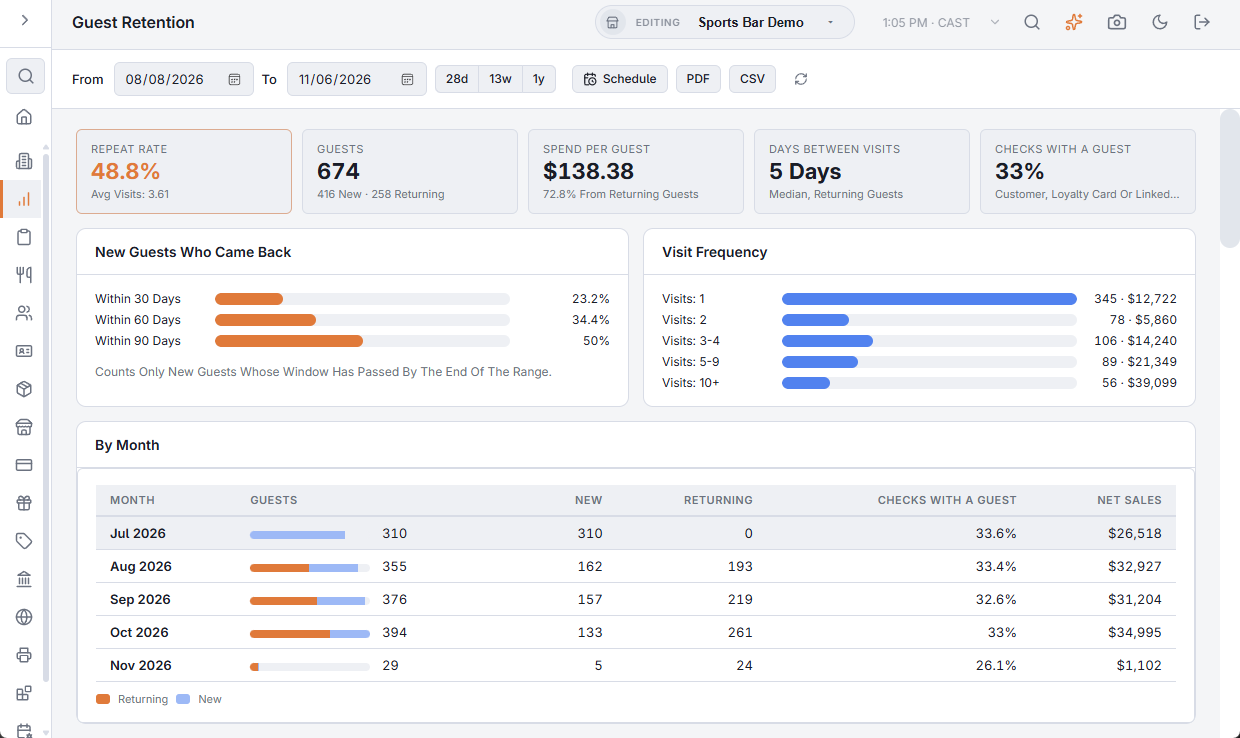
The toolbar
- From and To — the range. The page opens on the 13 weeks up to yesterday.
- 28d, 13w and 1y — the last 28 days, 13 weeks or a full year, ending yesterday.
- Schedule — emails the report as a PDF on a recurrence; the Away For (Days) and Min Visits values are saved with it. See Emailing the performance reports on a schedule.
- PDF (preview, download, email) and CSV — the same report as a file. See Exporting and PDF preview. The file’s section titles, column headings, day names and Yes/No values are in the language the Back Office is shown in; numbers use a dot for decimals with no thousands separator, and dates are written year-month-day, so a spreadsheet reads them the same in any language.
- The refresh button loads the figures again.
Who counts as a guest
A check has a guest when it names a customer (call center, online orders, a customer added at the POS) or carries a How loyalty works. Checks with neither are anonymous and are left out. The shared customers the delivery marketplaces and Uber Eats put on their orders are not guests. A visit is a business day with a settled check. When no check in the range names a guest, the page shows No Known Guests.
Checks With A Guest shows how many checks name one. Below 25% the card turns amber and a note warns that the other numbers describe only that share of your business — add the customer or swipe a loyalty card at the POS more often to see more.
The numbers
- Repeat Rate — guests with two or more visits in the range, with the average visits per guest.
- Guests — split into New (first visit ever falls in the range) and Returning.
- Spend Per Guest — with the share of sales from returning guests.
- Days Between Visits — the median gap for guests who came back.
- New Guests Who Came Back — within 30, 60 and 90 days, counting only new guests whose window has passed by the end of the range.
- Visit Frequency — guests and their sales by number of visits: 1, 2, 3–4, 5–9 and 10+.
- By Month — the 12 months up to the end of the range, whatever range is set: guests split into new and returning, the share of checks with a guest, and net sales.
- Repeat Rate By Channel — guests grouped by where they usually order (in store, call center, online ordering), with their repeat rate and spend per guest.
- Top Guests — the ten guests who spent the most in the range.
Lapsed regulars
Regulars are guests with at least Min Visits visits (default 3, from 2 to 50) in the year up to the end of the range; they are lapsed when they have not been back for Away For (Days) days (default 45, from 7 to 365). Change both boxes to suit how often your guests normally come. The list is sorted by visits and spend, with phone, email, last visit, spend, usual channel and an Offers badge for guests who accept offers (Send Offers on the Customer info fields and phone format).
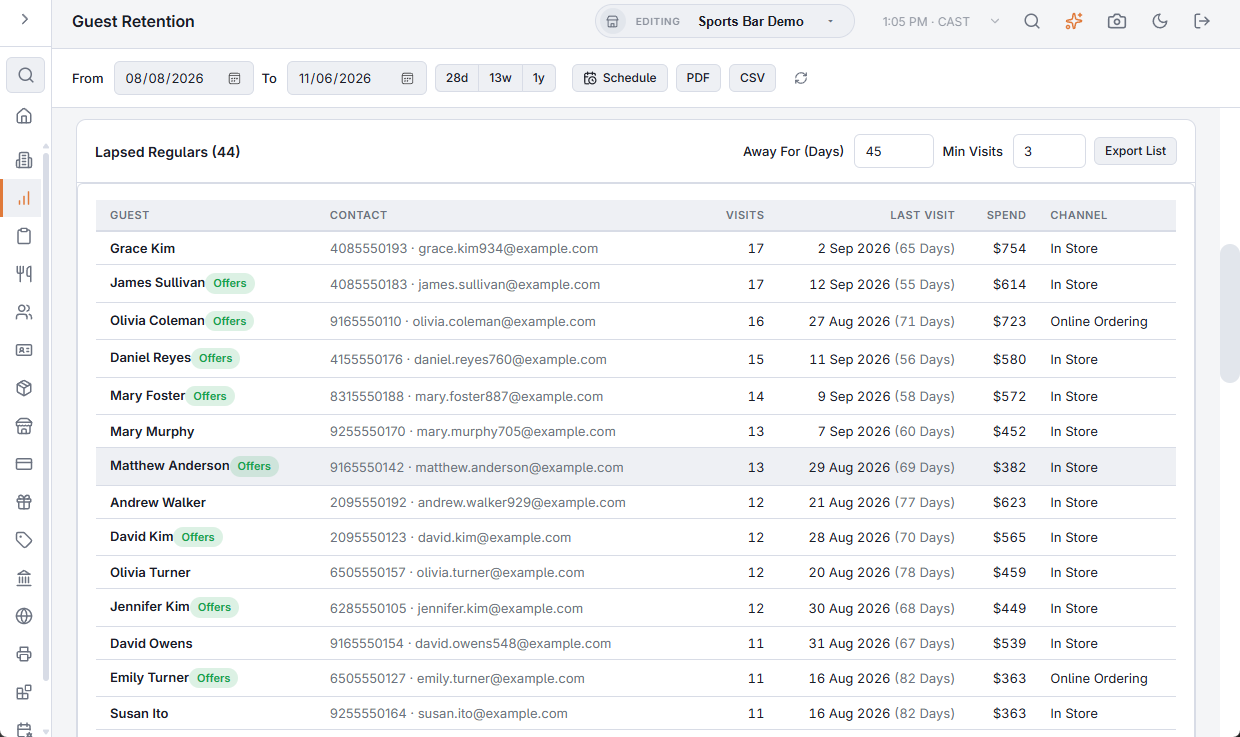
The page shows the first 100. When there are more, a line says Showing 100 Of {n}. Export The List For Up To 2,000 Of Them. Export List downloads up to 2,000 as a CSV, with headings in the Back Office language, for a WhatsApp, SMS or email campaign, with first and last visit and whether each guest accepts offers. Only message guests who accept offers.
The AI assistant can answer the same questions: “Which regulars haven’t we seen lately?”