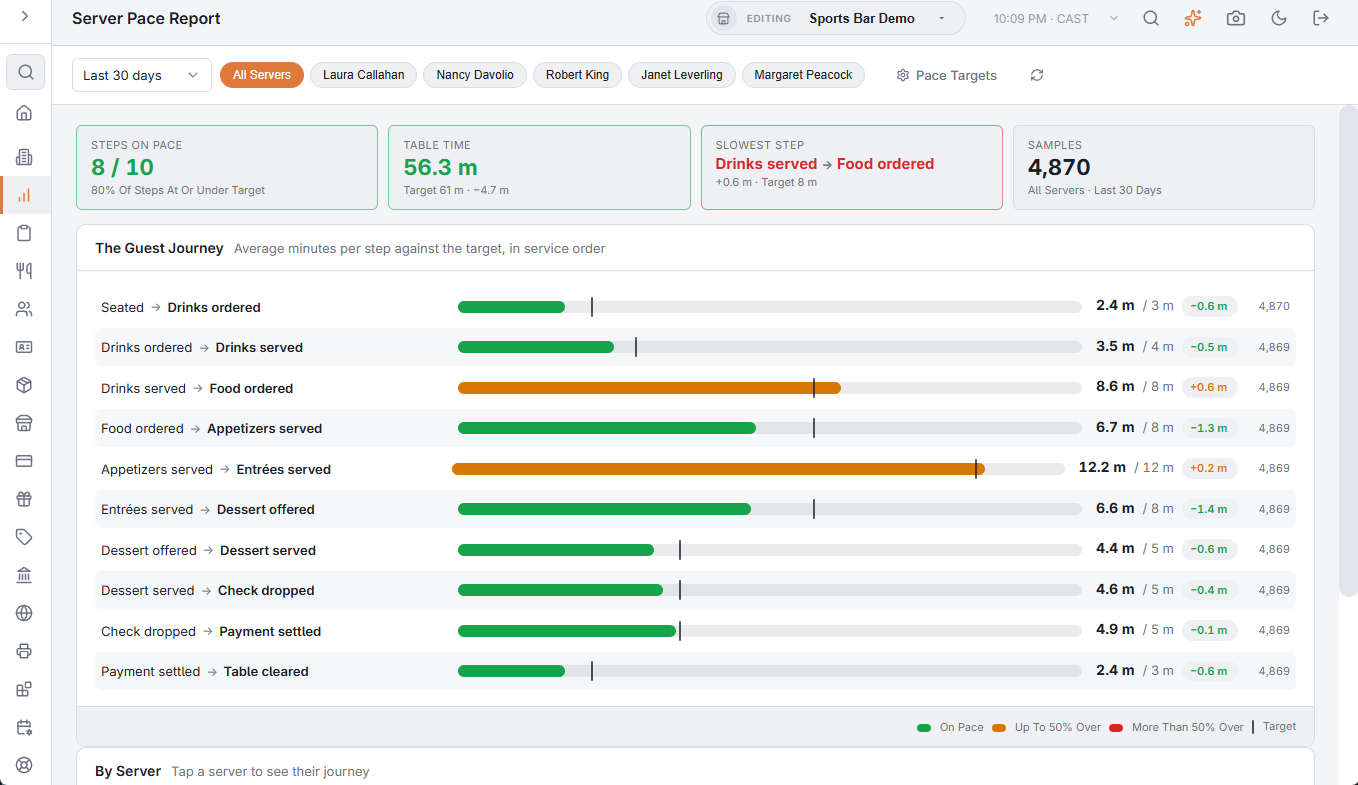
Back Office › Analytics › Performance › Server Pace Report shows how long each step of table service took on average, against the targets in the service pace rules, for all servers together or for one server. It covers the store you are working in.
Where the times come from
On a table-service order, the service pace panel on the order shows the next step of service, and the server taps Log when it happens: Seated, Drinks ordered, Food ordered and so on. See The service-pace panel and its colours.
- Only steps that have an active rule in this store are measured; a deleted rule no longer counts. A rule times the gap from its From Event to its Next Event on the same order; see Service-pace rules.
- A step counts only when both of its events were logged on the order. Steps nobody tapped are missing, not zero.
- Each order belongs to the server who owns it. Orders with no server are grouped as (unattributed).
The toolbar
- Last 7 days, Last 30 days or Last 90 days — orders started in that many days back from now. The page opens on Last 30 days.
- Server buttons — All Servers and one button per server, shown when the period has more than one server. Pick a server to see only their orders.
- Pace Targets opens the Service Pace Rules tab of Back Office › Store Setup › Order Entry Screen, where the targets are set.
- Refresh loads new figures.
The page has no store choice, CSV, PDF or Schedule.
Tiles
- Steps On Pace — how many steps averaged at or under their target, out of all the steps measured.
- Table Time — the step averages added up, against the targets added up, with the difference.
- Slowest Step — the step furthest over its target. When none is over, it reads Every Step On Target.
- Samples — the number of times the most-measured step was timed, for the server and days shown.
The Guest Journey
One bar per step, in service order. The bar is the average minutes; the mark on the track is the target. Beside it are the average, the target, the difference and the number of samples. Hover over a bar for the same figures.
| Color | Meaning |
|---|---|
| On Pace | The average is at or under the target. |
| Up To 50% Over | The average is over the target by up to half the target. |
| More Than 50% Over | The average is over the target by more than half the target. |
Only the rule’s Target is used here. Its Warn and Late minutes color the live tables on the floor, not this report.
By Server
With All Servers chosen and more than one server in the period, a table ranks the servers by the share of their steps on pace: Server, Steps On Pace, Table Time, Δ (table time against the targets), Slowest Step and Samples. Tap a server to see their journey.
Related: Floor overview overlay, Turn Times: how long parties really stay.