Back Office › Analytics › Performance › Staffing vs Demand lines up who was working with what came through the door, hour by hour, so the schedule can follow the sales instead of habit. It opens on the last 28 days, ending yesterday.
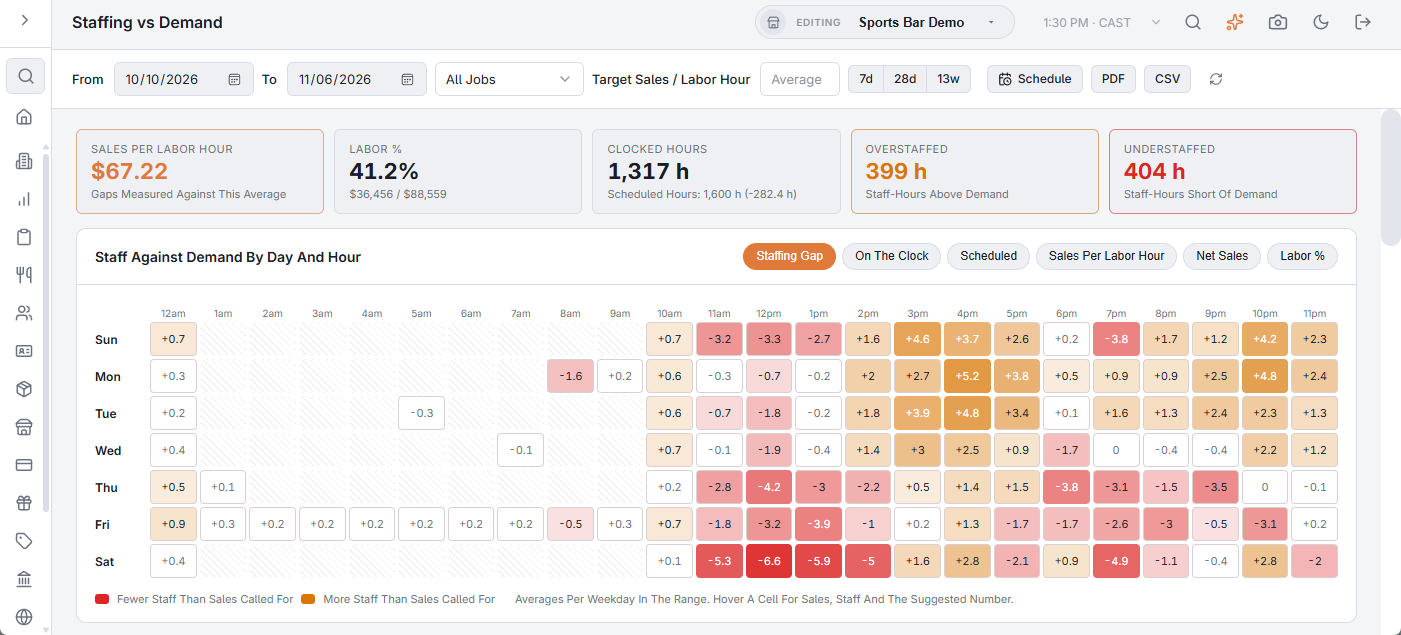
The toolbar
- From / To — the calendar days to include. 7d, 28d and 13w set a range ending yesterday in one tap.
- Job picker — shown when more than one job has punches or shifts in the range. All Jobs, or one job (servers, cooks, bartenders…). Sales stay the same; only the staff side changes.
- Target Sales / Labor Hour — the sales one hour of work should bring in. Leave it blank (it shows Average) and the page uses your own average for the range, so it shows where you run above and below your usual pace. Enter a figure (for example your budget) to measure against that instead.
- Schedule — emails the report on a schedule, with the job and target you picked. See Emailing the performance reports on a schedule.
- PDF — preview, download or email the report. CSV downloads the summary, the day-and-hour averages, the jobs and the days. Both are greyed out when the range has no sales. The file’s section titles, column headings, day names and Yes/No values are in the language the Back Office is shown in; numbers use a dot for decimals with no thousands separator, and dates are written year-month-day, so a spreadsheet reads them the same in any language.
- The refresh button loads the figures again.
The numbers at the top
- Sales Per Labor Hour — net sales ÷ hours worked. Under it, the target in use, or Gaps Measured Against This Average when the target box is blank.
- Labor % — labor cost ÷ net sales, with both amounts.
- Clocked Hours — with scheduled hours and the difference.
- Overstaffed / Understaffed — staff-hours above or below what the sales called for, over the whole range.
The grid
Staff Against Demand By Day And Hour has a row per day of the week and a column per hour. Each cell is averaged over every such day in the range (four Mondays in 28 days, for example). Cells with no sales and no staff at all are striped.
The Staffing Gap view is the one to act on: people on the clock minus the people the sales called for. Amber cells had more staff than needed; red cells had fewer. Gaps under half a person are left neutral. Hover a cell for its sales, checks, scheduled and clocked staff, the suggested number, sales per labor hour and labor %.
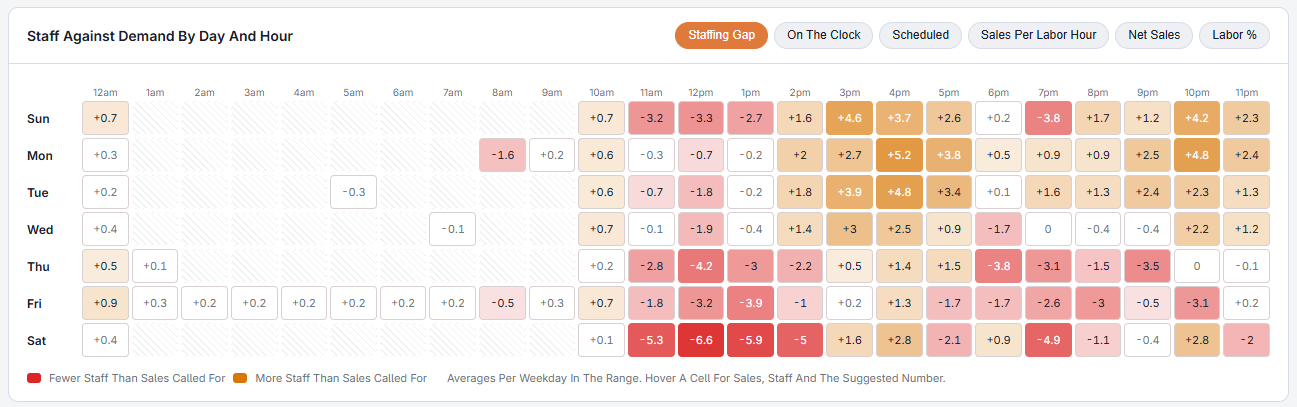
The other buttons colour the grid by On The Clock, Scheduled, Sales Per Labor Hour, Net Sales or Labor %.
By job and by day
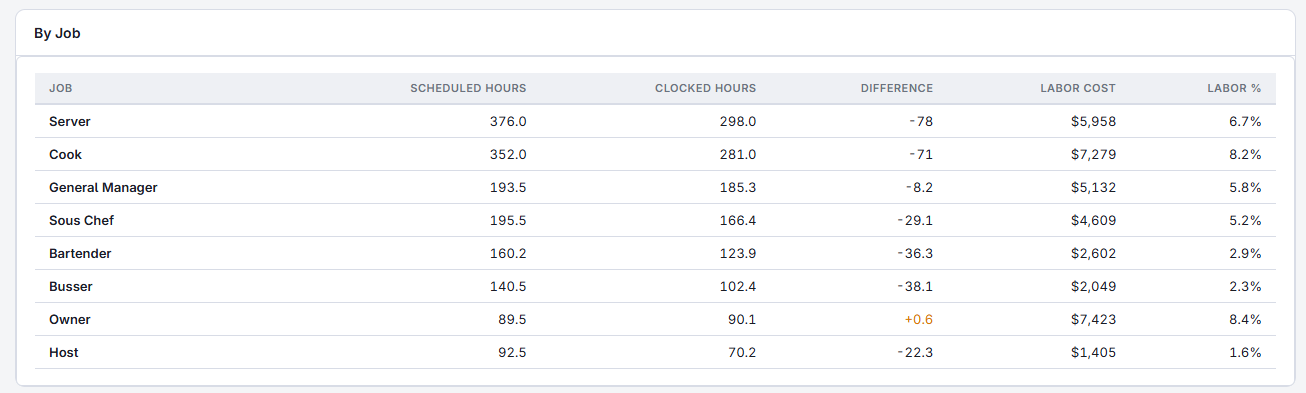
By Job appears when more than one job worked and the page shows all jobs. It compares scheduled hours, clocked hours, the difference, labor cost and labor % per job; the labor % is the job’s cost against the store’s total net sales. Click a job to filter the page to it; click it again for all jobs.
By Day lists every day that had sales or hours, with its net sales, checks, scheduled and clocked hours, sales per labor hour and labor %.
What to do about it
- Trim or shorten shifts in the amber hours, starting with the job that shows the biggest gap.
- Add a shift, or start one earlier, in the red hours — those are the hours guests wait.
- Where clocked hours run well over scheduled, look at early clock-ins and late clock-outs in Timesheets.