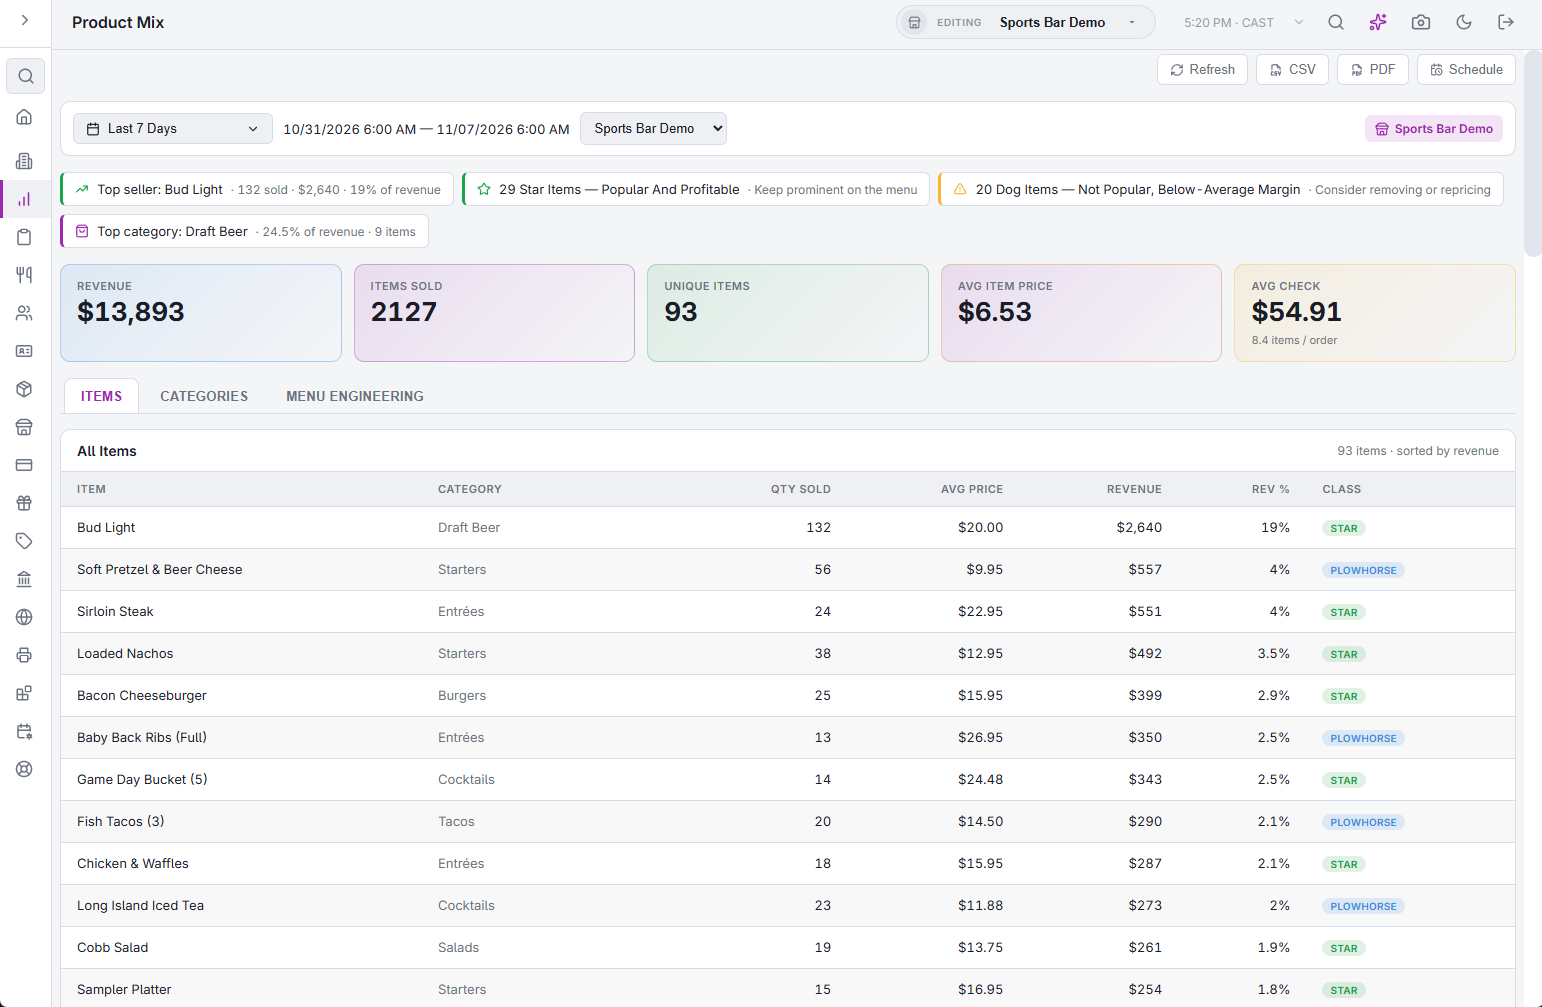
Back Office › Analytics › Performance › Product Mix shows what the menu sold in a date range: each item’s quantity and revenue, the categories, and a menu-engineering view that sorts the items by how often they sell and how much they bring in.
The toolbar
The toolbar works as on Sales performance: a date range (Last 7 Days to start), the exact business-day window, Store, Refresh, CSV, PDF and Schedule. There is no Day / Week / Month choice on this page.
What is counted
- Menu items sold on the business days in the range. Voided orders and lines removed from an order are left out.
- Modifiers are not counted as items, and their prices are not part of the item’s revenue.
- Revenue is the item’s price times the quantity sold.
Cards
- Revenue — the revenue of all items sold.
- Items Sold — the total quantity sold.
- Unique Items — how many different menu items sold at least once.
- Avg Item Price — revenue divided by items sold.
- Avg Check — item revenue divided by the number of orders, with the average items per order under it.
Above the cards, a strip shows up to four notes: the top seller, the number of Star items, the number of Dog items when there are five or more, and the top category.
Items
All Items, sorted by revenue: Item, Category, Qty Sold, Avg Price, Revenue, Rev % (share of all revenue) and Class (the item’s menu-engineering group), with a Total row.
Categories
By Category, sorted by revenue: Category, Items (how many different items sold in it), Qty Sold, Revenue and Rev % with a bar. Items without a category are grouped as Uncategorized.
Menu Engineering
Every item is placed in one of four groups by two splits: its quantity sold against the median quantity of all items in the range, and its revenue against the median revenue. At or above the median counts as high.
| Group | Volume | Revenue | The box lists |
|---|---|---|---|
| Stars | High | High | Revenue |
| Plowhorses | High | Low | Quantity sold |
| Puzzles | Low | High | Revenue |
| Dogs | Low | Low | Quantity sold |
Each box shows how many items it holds and lists the first eight.
All Stores
With All Stores selected, items with the same name and category at different stores are added up into one row, since each store has its own menu. The totals, the shares, the categories, the menu-engineering groups and the notes are then worked out over the combined items, as for one menu. The PDF covers one store: with more than one store, pick a store before you open it.
CSV
The CSV has three sections: All Items, By Category, and a daily section with the items sold, revenue and orders for each day. The class is written out as its group name.
Related: Product Mix Comparison, Price Change Impact: what a price change did to sales, Check Builder: attach rates and upselling by server.