Back Office › Analytics › Performance › Sales Performance compares each day’s sales with a projection built from the store’s own recent history. Use it to see which days ran ahead of a normal week and which fell behind.
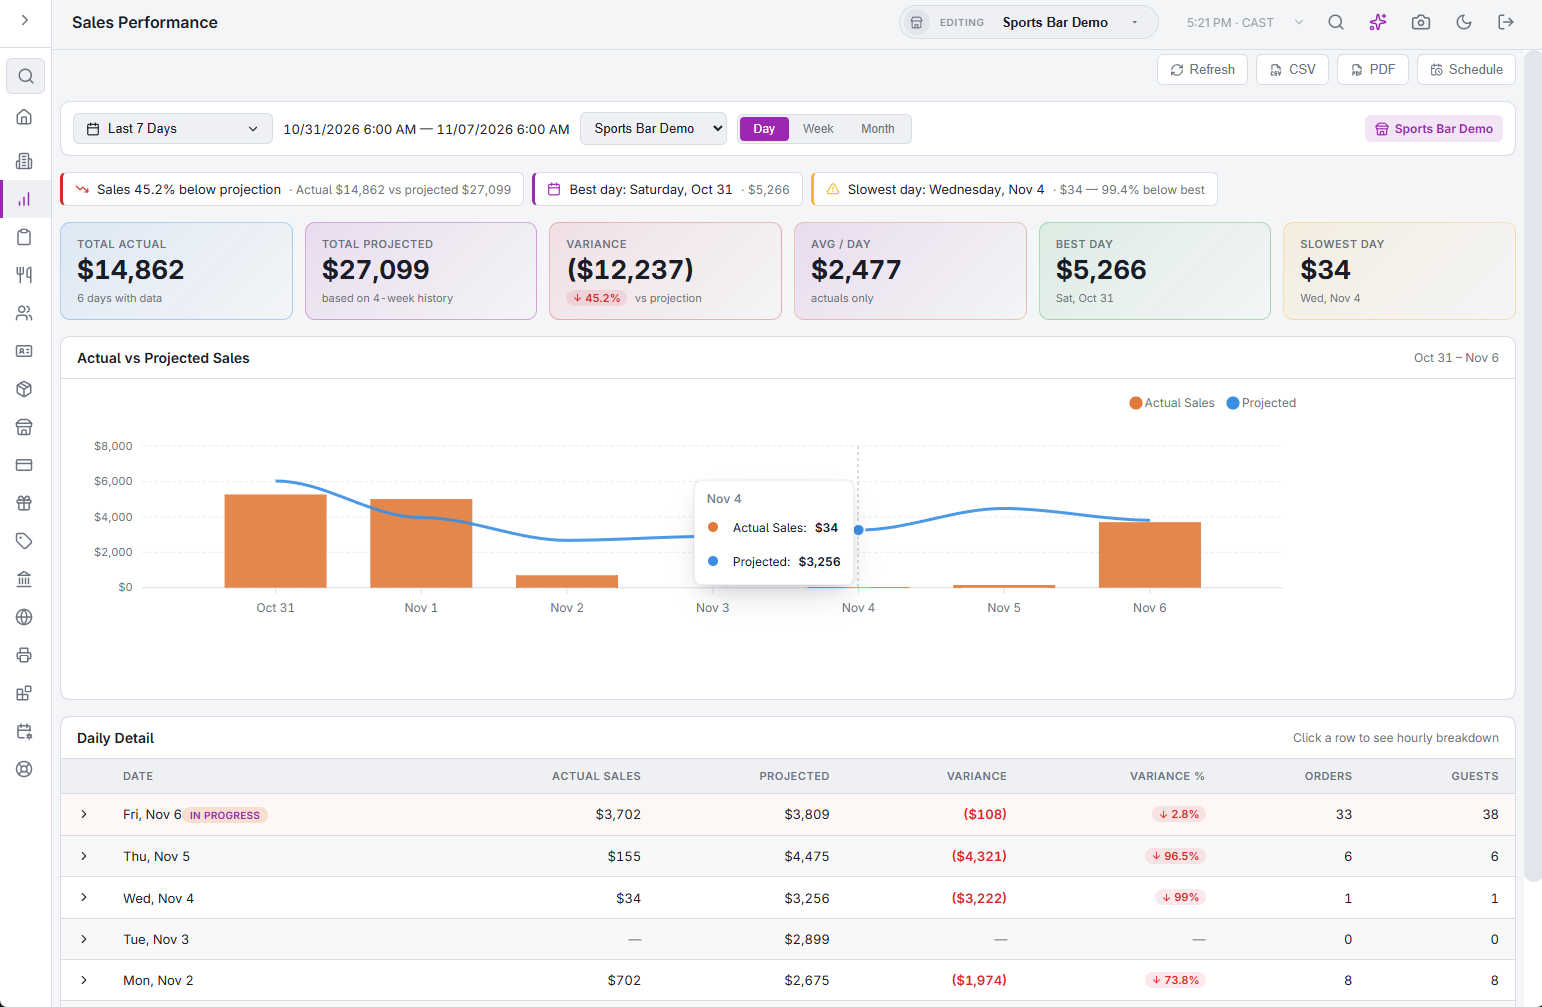
The toolbar
- Date range — the button opens the presets: Today, Yesterday, This Week, Last Week, Last 7 Days, Last 30 Days, Month to Date, Last Month and Year to Date, with Start and End boxes for a range of your own. The page opens on Last 7 Days. This Week and Last Week start on the store’s Business Week Start Day (General settings), or on Sunday when it is not set.
- Next to it is the exact time window the figures cover. The days are business days: each one starts at the store’s Business Day Start Time, so a range of one day runs from that time to the same time the next day. See The business day and when it rolls over.
- Store — one store, or All Stores to add up every store you can see. The page opens on the store you are working in.
- Day / Week / Month — groups the chart, the detail table, the CSV and the PDF by week or by calendar month. Weeks start on the store’s Business Week Start Day. The cards above stay daily.
- Refresh (Ctrl+R) loads new figures. Without it, the figures for one store are kept for up to five minutes.
- CSV (Ctrl+E) downloads the detail table as it is grouped. PDF opens a preview you can download or email; Schedule emails the report on a schedule. A PDF covers one store, so with All Stores and more than one store the PDF button stays greyed out until you pick a store. See Exporting and PDF preview and Emailing the performance reports on a schedule.
Actual and projected sales
Actual sales are the totals of the business day’s orders. Voided orders are left out.
A day’s projection is the average sales of the same weekday in the four weeks before that day. For a Friday, that is the four Fridays just before it. Days with no sales are left out of the average, so a day the store was closed does not pull it down, and a day with no sales in all four weeks projects zero. Only finished days are used: today and later days never count, so a day ahead in the range is projected from the weeks that have already passed, and a day more than four weeks ahead is projected from the same weekday in the four weeks before today.
Today is marked In Progress. Its projection runs only up to the current time: the average of each hour so far on the same weekday over the last four weeks. Today’s variance compares what the store has sold with what a normal day had sold by this hour.
Days after today show their projection and a dash for actual sales.
Total Projected and the variance count the projections up to today only. On This Week or any range that ends after today, the later days still show their projection in the table, but they are not in the totals, so the variance compares the days so far.
Cards
- Total Actual — the period’s sales, with the number of days that had sales.
- Total Projected — the sum of the daily projections up to today.
- Variance — actual minus projected, in money and as a percentage. Green when sales are ahead, red when behind.
- Avg / Day — the average over the days that had sales.
- Best Day and Slowest Day — the days with the highest and lowest sales. Today is not ranked. Slowest Day is hidden when only one day qualifies.
Above the cards, a strip shows up to four notes: sales 3% or more above or below the projection, the best day, the slowest day when it is more than 30% below the best, and today pacing 10% or more ahead of or behind its projection.
Actual vs Projected Sales
The chart shows actual sales as bars and the projection as a line, one point per day, week or month.
All Stores
With All Stores selected, each day’s actual and projected sales, orders and guests are added up over the stores. The cards, the best and slowest day and the notes are then worked out from those totals, with the same rules as for one store.
Detail table
The table is titled Daily Detail, Weekly Detail or Monthly Detail, newest first, with a Total row at the bottom.
| Column | What it shows |
|---|---|
| Date / Week / Month | The day, or the first and last day of the week, or the month. The first and last weeks or months are cut to the range. |
| Actual Sales | Sales of the period. A dash means no sales yet. |
| Projected | The projection for the period. |
| Variance and Variance % | Actual minus projected. A shortfall shows in brackets. |
| Orders | Orders taken, voided orders left out. |
| Guests | The orders’ guest counts. An order without a guest count counts as one guest. |
In the Day view, click a row to open that day’s hourly breakdown: each hour’s sales, its projection (the average of that hour on the same weekday in the four weeks before that day), and the peak hour highlighted. Click the row again to close it. Weeks and months have no hourly breakdown.
Related: Labor performance, Product mix, Demand forecast.