Back Office › Analytics › Performance › Kitchen Performance shows how fast the kitchen displays cleared their tickets: average and slowest times, the share that went late, and where in the day and on which station the kitchen fell behind. The page is offered on plans that include the kitchen display.
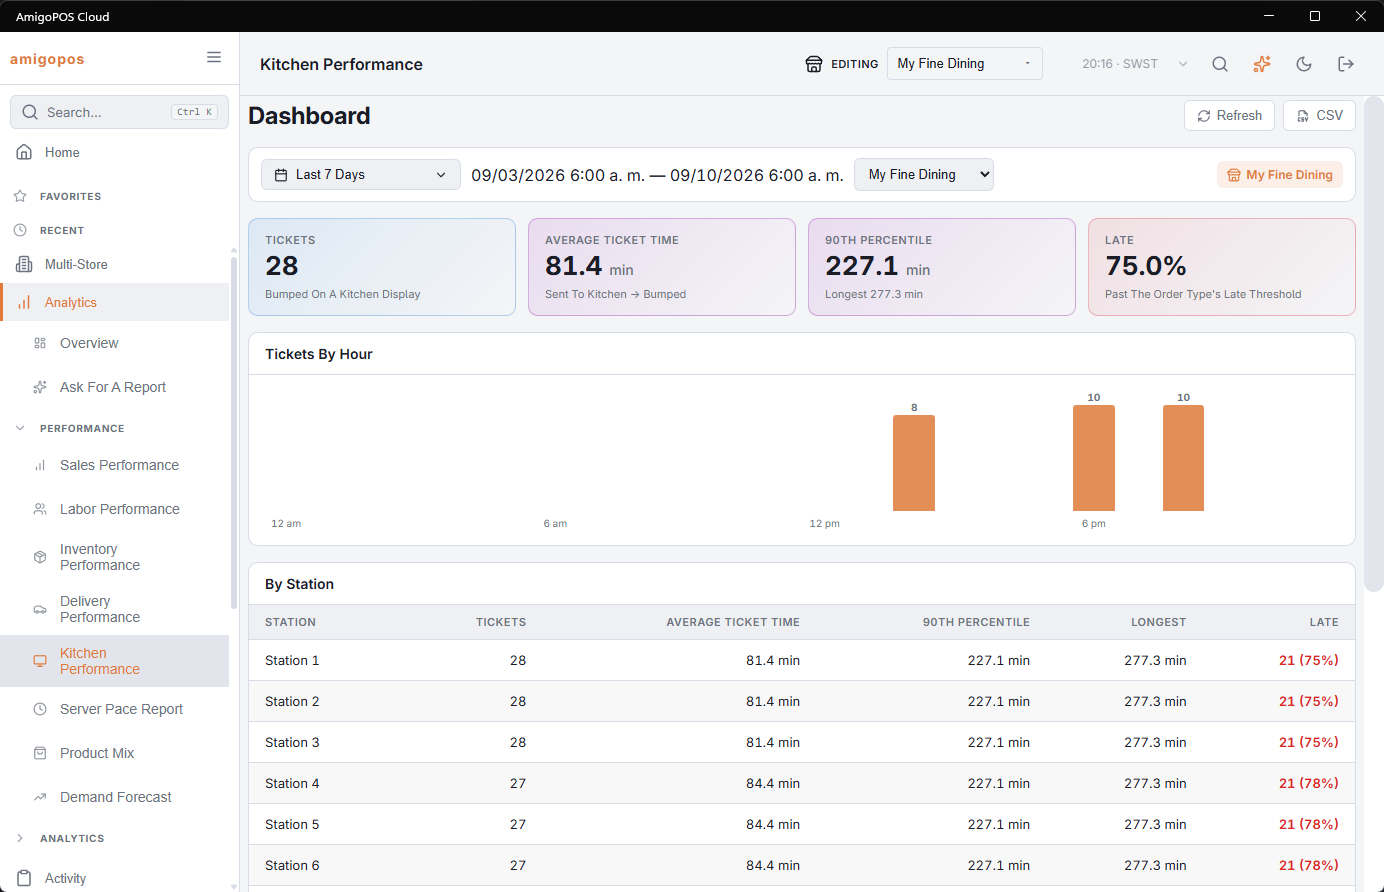
The toolbar
- Date range and Store work as on Sales performance. The page opens on Last 7 Days and on the store you are working in; All Stores adds every store you can see together.
- Refresh loads new figures.
- CSV downloads the By Station table, with the times in seconds.
There is no Day / Week / Month choice, PDF or Schedule on this page.
What is measured
Every time a kitchen display bumps an order, the time is recorded. A ticket’s time runs from when its first lines were sent to that station to the bump. A scheduled order is timed from the time it was released to the kitchen. A display that sends the same bump twice is recorded once.
A ticket is late when its time reached the late minutes of its order type, or the store’s Late After (Minutes) when the order type has none. Whether a ticket was late is decided when it is bumped, so changing the thresholds changes only later tickets. See Aging and late thresholds.
Which bumps count
- A ticket counts once for each station that bumped it. An order that went to the grill and the fryer is two tickets with two times. This is a kitchen measure, not an order count.
- Bumps on displays that follow every station — expeditor, bagging and order status screens, including tapping an order off the status screen — are left out, so they do not inflate the stations.
- In a kitchen with only an all-station screen, each order counts once, at its first bump.
- A display that covers several stations counts once in the totals and once in each of its stations’ rows.
- Item strikes are not timed on their own; the time stops when the card is bumped.
Cards
- Tickets — tickets bumped on a kitchen display.
- Average Ticket Time — from sent to the kitchen to bumped, in minutes.
- 90th Percentile — nine tickets in ten were done within this time. The line under it gives the longest ticket.
- Late — the share of tickets past their late threshold. Green up to 5%, amber up to 15%, red above.
Tables
- Tickets By Hour — one bar per hour of the day, by the hour of the bump. Hover over a bar for its tickets, average time and late count. A bar where half or more of the tickets were late is marked.
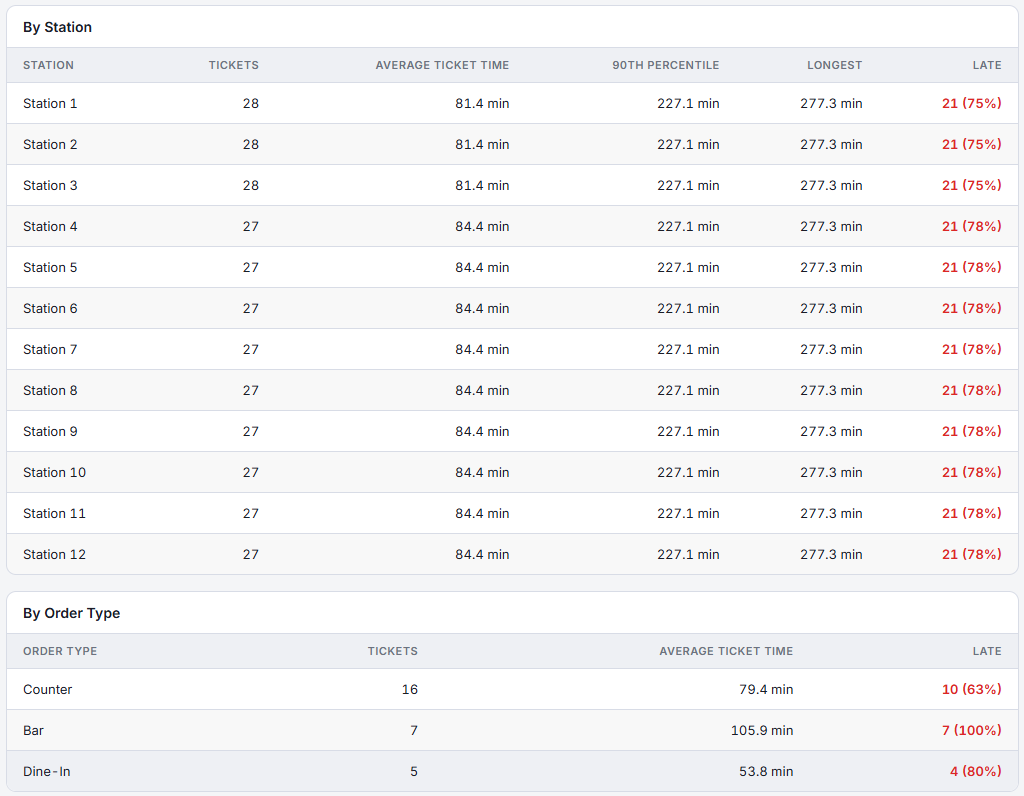
- By Station — one row per station, named Station 1, Station 2 and so on: Tickets, Average Ticket Time, 90th Percentile, Longest and Late (count and share). The slowest station is the one to look at first.
- By Order Type — tickets, average time and late per order type, each judged against its own threshold.
- By Day — tickets, average time and late per business day. Shown when the range has more than one day with bumps.
Related: Bumping, item bumps and the Done tray, The expeditor display.