Back Office › Analytics › Performance › Labor Performance puts the labor cost and hours from the time clock next to the sales of the same days. It shows labor as a share of sales and the sales earned for each hour worked.
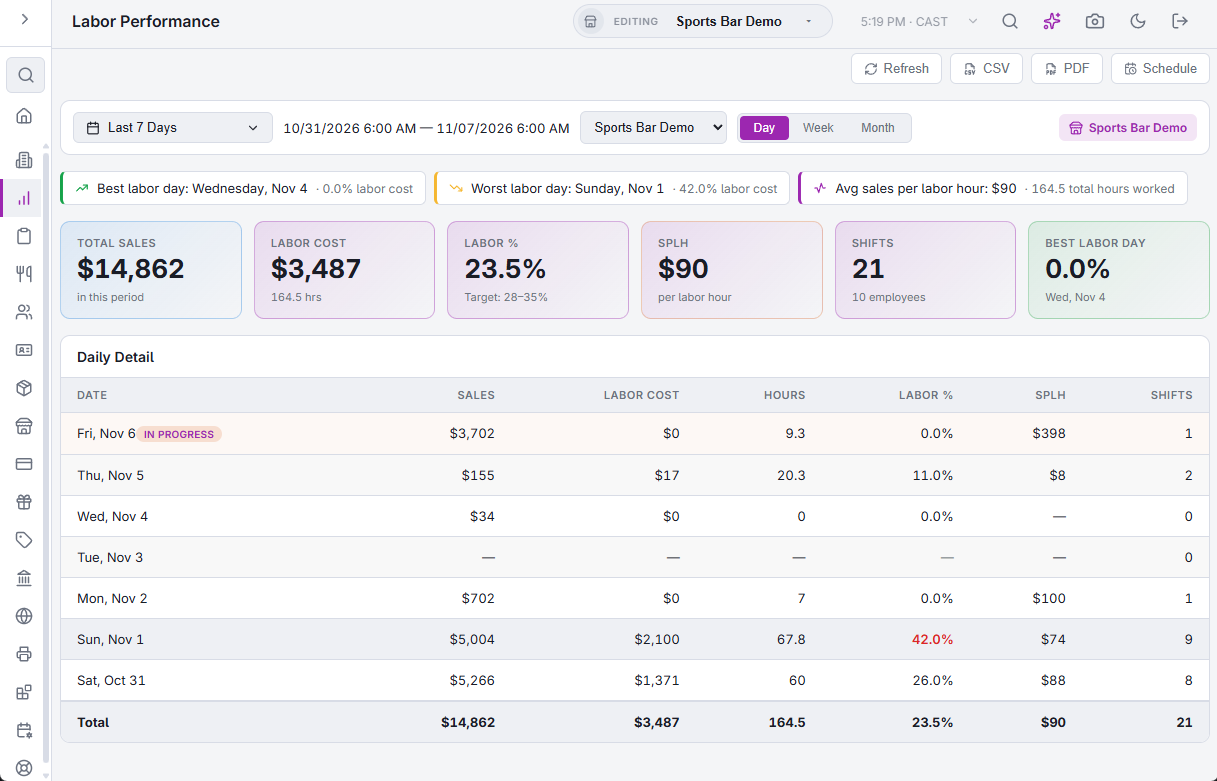
The toolbar
The toolbar works as on Sales performance: a date range (Last 7 Days to start), the exact business-day window, Store (one store or All Stores), Day / Week / Month for the table, Refresh, CSV, PDF and Schedule. The cards stay daily whichever grouping you choose.
Where the figures come from
- Sales are the totals of the business day’s orders, voided orders left out.
- Labor cost is the cost recorded on the time cards.
- Hours run from clock-in to clock-out. A shift that is still clocked in counts up to now.
- Each shift counts on the business day it started, even when it ends after midnight.
Cards
- Total Sales — the period’s sales.
- Labor Cost — the period’s labor cost, with the hours worked.
- Labor % — labor cost as a percentage of sales. The card is green from 28% to 35%, amber above 35% up to 40%, and red above 40%. Below 28% it stays neutral. The 28–35% target is fixed and is not a store setting.
- SPLH — sales per labor hour: sales divided by hours worked.
- Shifts — the number of time-card shifts, with the number of employees who clocked in.
- Best Labor Day — the day with the lowest labor %, among days with sales. Today is not ranked.
Above the cards, a strip shows up to four notes: labor above 40% of sales, labor below 20% with more than five shifts (which may mean understaffing), labor in the 28–35% range, the best labor day, the worst labor day when it is more than five points above the best, and the average sales per labor hour.
All Stores
With All Stores selected, each day’s sales, labor cost, hours and shifts are added up over the stores. Best Labor Day and the notes are worked out from those totals. An employee who clocked in at more than one store counts once in the number under Shifts.
Detail table
The table is titled Daily Detail, Weekly Detail or Monthly Detail, newest first, with a Total row. Today is marked In Progress.
| Column | What it shows |
|---|---|
| Date / Week / Month | The day, the week (first to last day) or the month. |
| Sales | Sales of the period. |
| Labor Cost | Labor cost of the shifts that started in the period. |
| Hours | Hours worked. |
| Labor % | Labor cost as a percentage of sales, colored as on the card. A dash when there were no sales. |
| SPLH | Sales divided by hours. A dash when no hours were worked. |
| Shifts | Shifts that started in the period. |
A day with a high labor % is either a slow day with normal staffing or a normal day with too many hours. Compare its Sales and Hours with similar days to tell which.
Related: Staffing vs Demand: the right people at the right hour, Employee analytics, Time clock (punch in/out, breaks).