Back Office › Analytics › Performance › Inventory Performance puts the cost of the ingredients used next to sales, lists the ingredients that cost the most, and shows what is at or below its reorder level right now. The page is offered on plans that include Inventory.
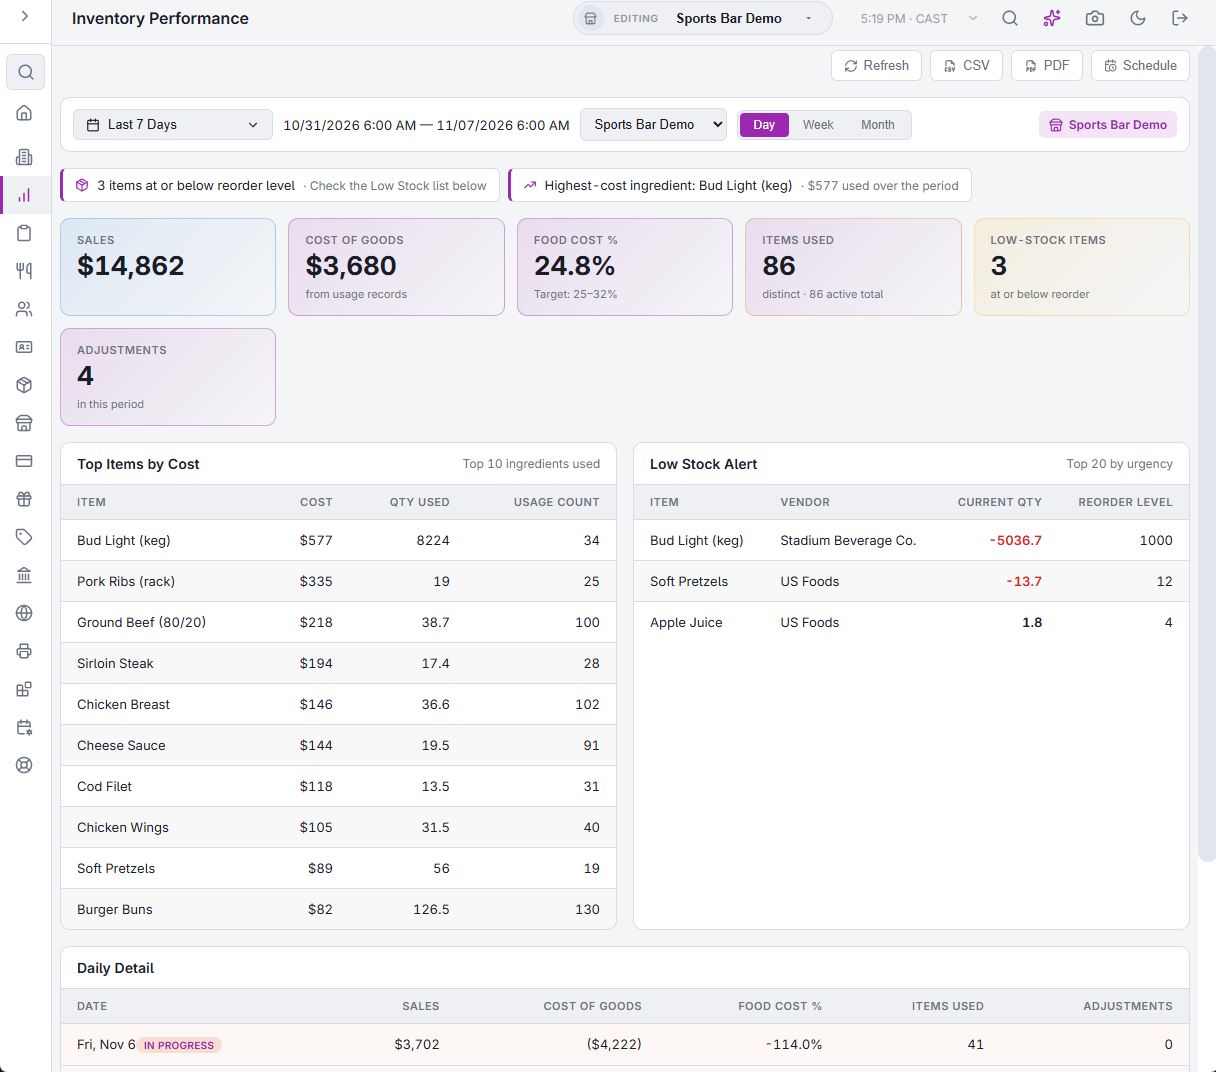
The toolbar
The toolbar works as on Sales performance: a date range (Last 7 Days to start), the exact business-day window, Store (one store or All Stores), Day / Week / Month for the detail table, Refresh, CSV, PDF and Schedule.
Where the figures come from
- Sales are the totals of the business day’s orders, voided orders left out.
- Cost of Goods is the cost on the inventory usage records: the ingredients taken out by the recipes of the items sold, and waste entries. Stock given back, for example by a refund, is taken off. A menu item without a recipe adds no cost. See Recipes (yield, cost, ingredients).
- Adjustments count the entries in the inventory adjustment log. A waste entry writes one of these too.
Cards
- Sales — the period’s sales.
- Cost of Goods — the cost of the ingredients used in the period.
- Food Cost % — cost of goods as a percentage of sales. The card is green from 25% to 32%, amber above 32% up to 35%, and red above 35%. Below 25% it stays neutral. The 25–32% target is fixed and is not a store setting.
- Items Used — how many different inventory items were used in the period, against the number of active items.
- Low-stock items — every item at or below its reorder level, checked the same way as the Low Stock Alert list. The list shows only the 20 most urgent, so the card can be higher than the number of rows. Green at none, amber from one to four, red at five or more.
- Adjustments — inventory adjustments in the period.
Above the cards, a strip shows up to four notes: food cost above 35%; food cost below 20% when cost of goods is over 100 (check for missing usage records); food cost in the 25–32% range; the number of low-stock items; more than 20 adjustments in the period; and the highest-cost ingredient.
Top Items by Cost
The ten ingredients whose usage cost the most in the period, with Cost, Qty Used and Usage Count (the number of usage records). These are the items where a price change from the vendor or a portion that runs heavy costs the most.
Low Stock Alert
Up to 20 items whose quantity on hand is at or below their reorder level, most urgent first (the lowest on hand compared with the reorder level). Columns: Item, Vendor, Current Qty and Reorder Level. A quantity of zero or less shows in red.
- The list shows the stock on hand now. It does not change with the date range.
- Only active items with a reorder level above zero are checked. An item without a reorder level never appears here.
Detail table
Daily Detail, Weekly Detail or Monthly Detail, newest first, with Sales, Cost of Goods, Food Cost %, Items Used and Adjustments for each period. In the Week and Month views each row is worked out over the whole week or month, so Items Used counts each item once per row. Today’s row is marked In Progress.
CSV
The CSV has four sections: the detail table, Top Items by Cost, Low Stock Alert and the notes from the strip, written out as text.
Related: How inventory works, Inventory counts, Daypart Prime Cost: food and labor by daypart.