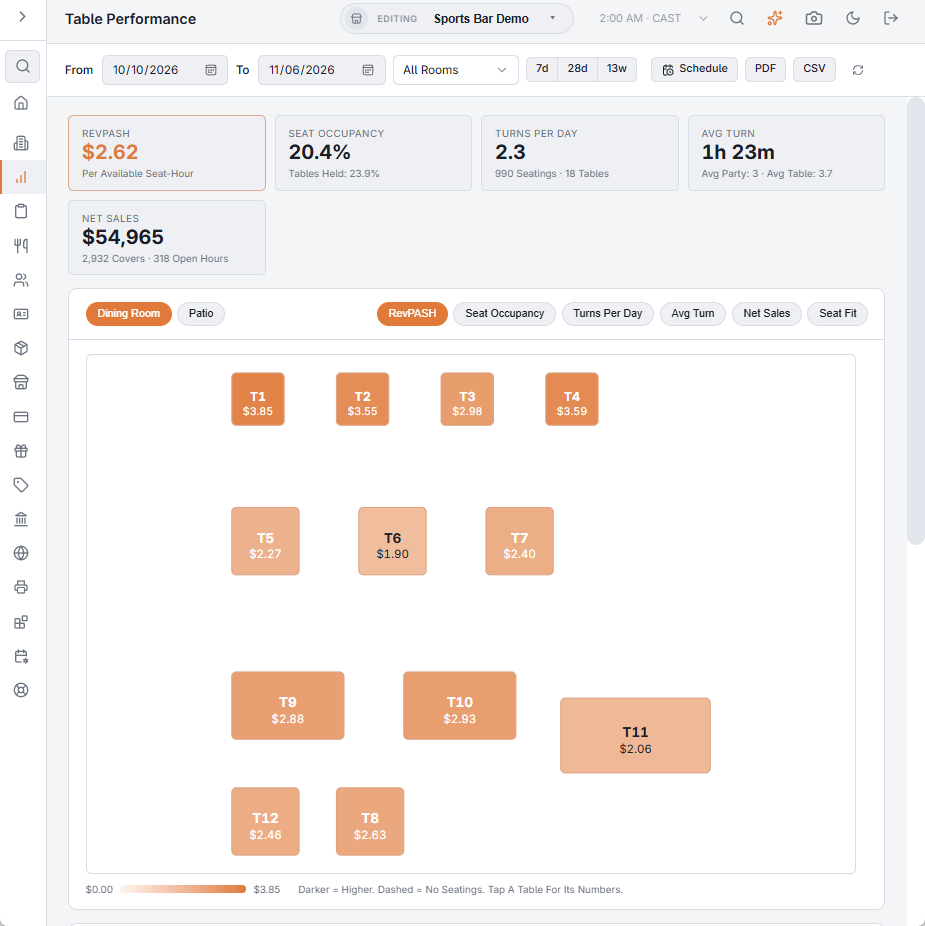
Back Office › Analytics › Performance › Table Performance draws your seating chart with every table coloured by the number you pick, so the tables that earn their place — and the corner nobody wants to sit in — show at a glance. It opens on the last 28 business days, ending yesterday.
The toolbar
- From / To — the business days to include. 7d, 28d and 13w set a range ending yesterday in one tap.
- Room picker — shown when your seating chart has more than one room; pick one to see only its tables, or All Rooms.
- Schedule — emails the report on a schedule, for the room you picked. See Emailing the performance reports on a schedule.
- PDF — preview, download or email the report. CSV downloads the summary and every table’s figures; it is greyed out when the range has no seatings. The file’s section titles, column headings, day names and Yes/No values are in the language the Back Office is shown in; numbers use a dot for decimals with no thousands separator, and dates are written year-month-day, so a spreadsheet reads them the same in any language.
- The refresh button loads the figures again.
The numbers at the top
- RevPASH — net sales per available seat-hour for the whole floor (see RevPASH: revenue per seat-hour).
- Seat Occupancy — how much of the seat time had a guest in it; Tables Held is the same for whole tables.
- Turns Per Day — seatings per table per open day, with the number of seatings and tables.
- Avg Turn — how long a party holds a table, with the average party size next to the average table size.
- Net Sales — sales on the floor plan’s tables, without tax, tips or delivery, with covers and open hours.
The floor plan
Use the buttons on the right of the card to colour the tables by RevPASH, Seat Occupancy, Turns Per Day, Avg Turn, Net Sales or Seat Fit. Each table shows its name and value. The darker the table, the higher the number; a dashed table had no seatings at all in the range. With more than one room, the room buttons on the left switch the plan.
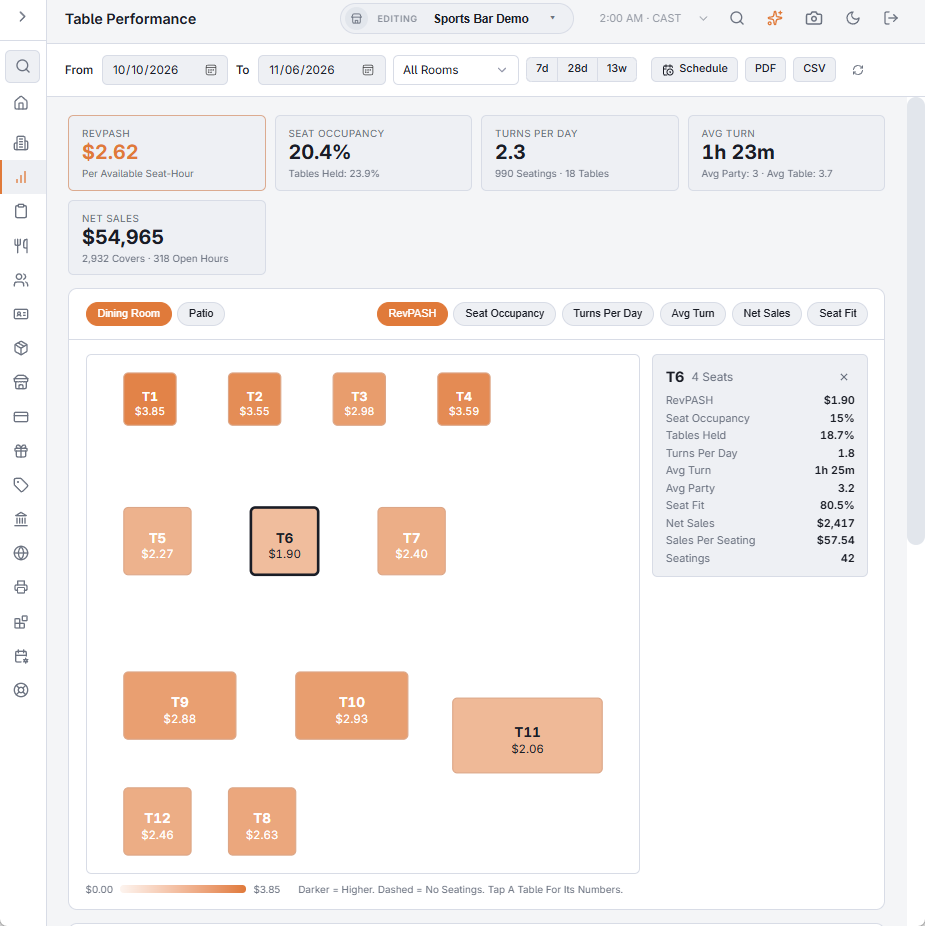
Tap a table to open its card with all of its numbers: RevPASH, seat occupancy, tables held, turns per day, average turn, average party, seat fit, net sales, sales per seating and seatings. Tap it again (or the ×) to close it.
The table list
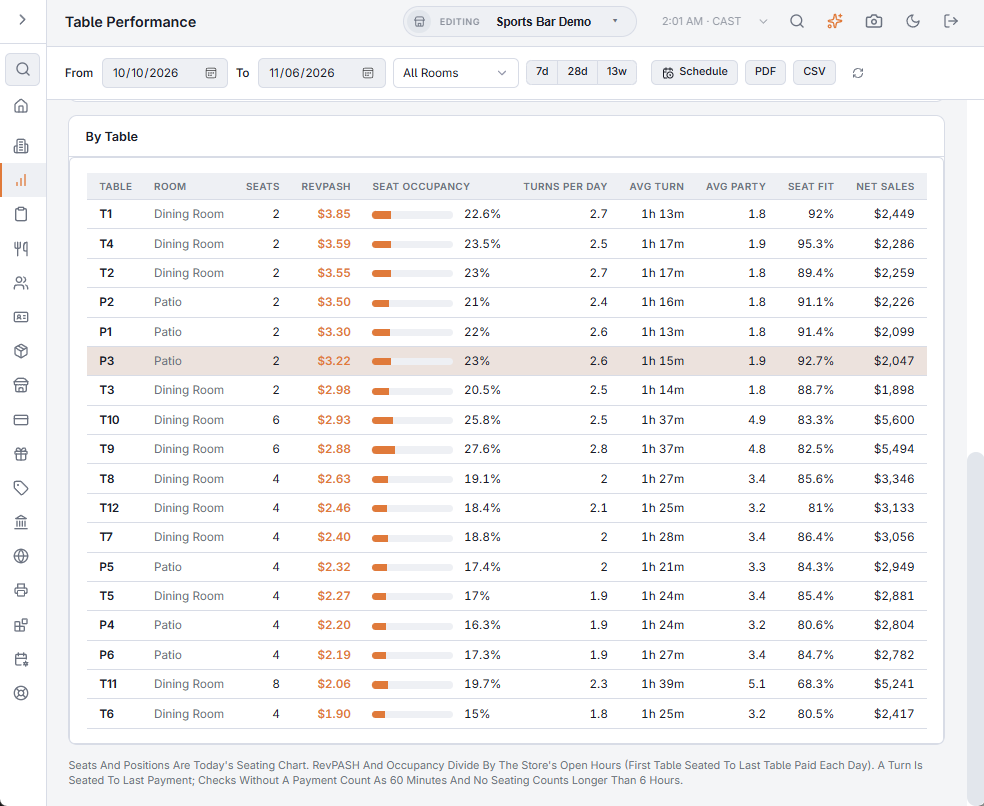
By Table, under the plan, lists every table best first by RevPASH, with its seats, RevPASH, occupancy, turns per day, average turn, average party, seat fit and net sales. With more than one room and no room picked, a column shows each table’s room. Tap a row to find the table on the plan.
What to look for
- A light table among dark ones — guests avoid it (draft, kitchen door, no view) or hosts don’t seat it. Move it, change it, or seat it first.
- A big table with low seat fit — small parties are sitting at it; see Table Fit: party sizes against table sizes.
- A slow turn on one table — check Turn Times: how long parties really stay for the slowest-turning tables.
The AI assistant can answer the same questions, for example “Which tables earn the most?”
Combined tables
A party that held more than one table is a turn at each of them, with its sales and covers shared by seat count: ten guests at a 4-seat and a 6-seat table count as 4 and 6. Its check is counted at its first table, it is one party in Avg Party, and its time is left out of Avg Turn. When the period has any, a Combined Tables note above the footnote gives their number. See Combining tables for a large party.